Immigrants from Nigeria vs Polish Median Male Earnings
COMPARE
Immigrants from Nigeria
Polish
Median Male Earnings
Median Male Earnings Comparison
Immigrants from Nigeria
Poles
$51,310
MEDIAN MALE EARNINGS
4.2/ 100
METRIC RATING
230th/ 347
METRIC RANK
$58,139
MEDIAN MALE EARNINGS
97.3/ 100
METRIC RATING
103rd/ 347
METRIC RANK
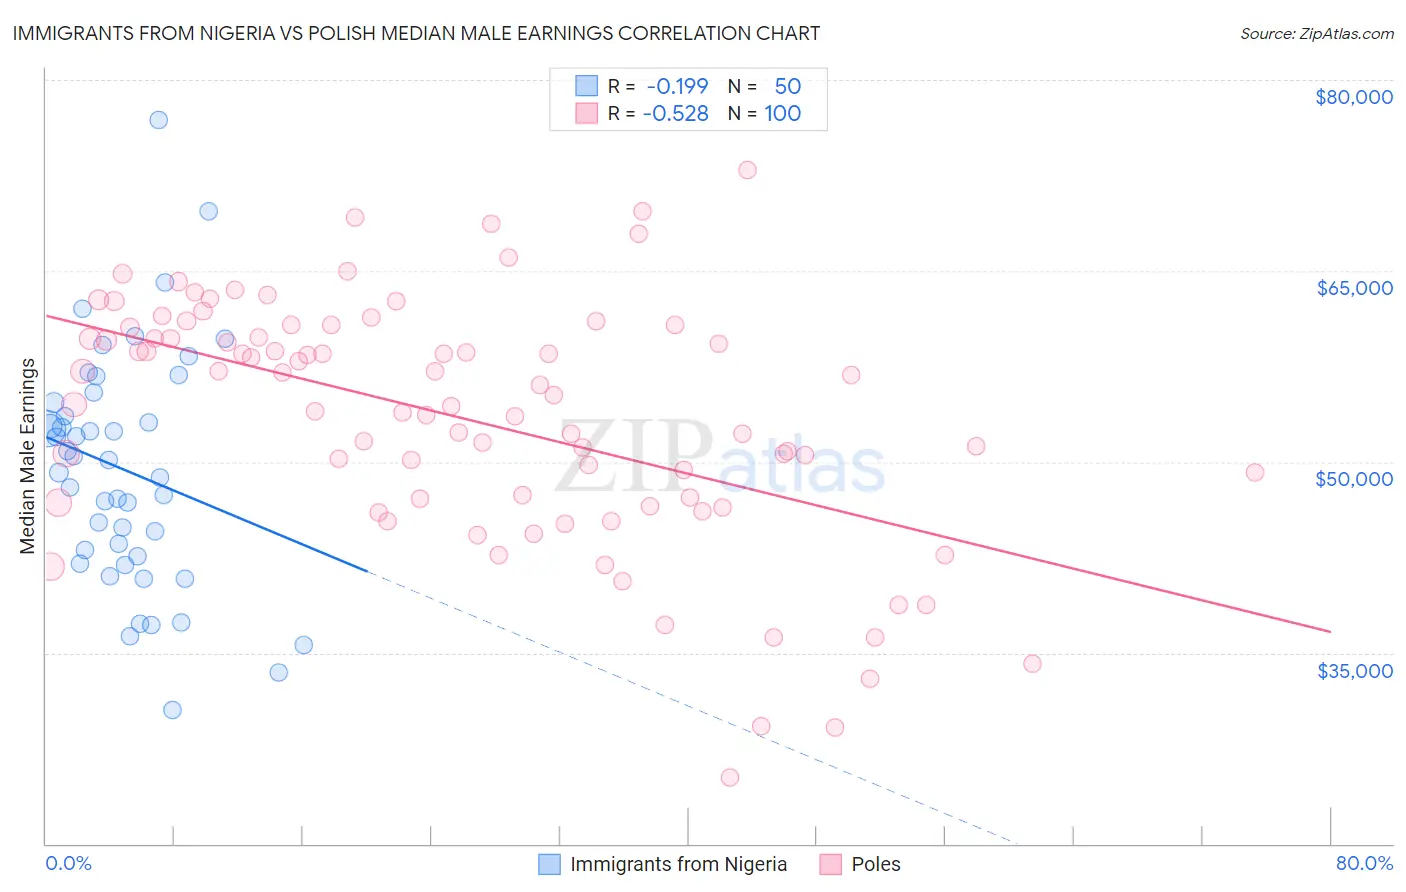
Immigrants from Nigeria vs Polish Median Male Earnings Correlation Chart
The statistical analysis conducted on geographies consisting of 283,479,076 people shows a poor negative correlation between the proportion of Immigrants from Nigeria and median male earnings in the United States with a correlation coefficient (R) of -0.199 and weighted average of $51,310. Similarly, the statistical analysis conducted on geographies consisting of 559,585,611 people shows a substantial negative correlation between the proportion of Poles and median male earnings in the United States with a correlation coefficient (R) of -0.528 and weighted average of $58,139, a difference of 13.3%.
Median Male Earnings Correlation Summary
| Measurement | Immigrants from Nigeria | Polish |
| Minimum | $30,472 | $25,204 |
| Maximum | $76,820 | $72,933 |
| Range | $46,348 | $47,729 |
| Mean | $49,348 | $53,382 |
| Median | $49,638 | $54,879 |
| Interquartile 25% (IQ1) | $42,561 | $46,953 |
| Interquartile 75% (IQ3) | $54,633 | $60,187 |
| Interquartile Range (IQR) | $12,072 | $13,234 |
| Standard Deviation (Sample) | $9,267 | $9,652 |
| Standard Deviation (Population) | $9,173 | $9,604 |
Similar Demographics by Median Male Earnings
Demographics Similar to Immigrants from Nigeria by Median Male Earnings
In terms of median male earnings, the demographic groups most similar to Immigrants from Nigeria are Immigrants from Trinidad and Tobago ($51,376, a difference of 0.13%), Barbadian ($51,236, a difference of 0.14%), Samoan ($51,389, a difference of 0.16%), Sudanese ($51,216, a difference of 0.18%), and Trinidadian and Tobagonian ($51,446, a difference of 0.27%).
| Demographics | Rating | Rank | Median Male Earnings |
| Ecuadorians | 5.5 /100 | #223 | Tragic $51,596 |
| Immigrants | Cambodia | 5.5 /100 | #224 | Tragic $51,594 |
| Immigrants | Sudan | 5.0 /100 | #225 | Tragic $51,489 |
| Japanese | 4.9 /100 | #226 | Tragic $51,473 |
| Trinidadians and Tobagonians | 4.8 /100 | #227 | Tragic $51,446 |
| Samoans | 4.6 /100 | #228 | Tragic $51,389 |
| Immigrants | Trinidad and Tobago | 4.5 /100 | #229 | Tragic $51,376 |
| Immigrants | Nigeria | 4.2 /100 | #230 | Tragic $51,310 |
| Barbadians | 3.9 /100 | #231 | Tragic $51,236 |
| Sudanese | 3.9 /100 | #232 | Tragic $51,216 |
| Aleuts | 3.7 /100 | #233 | Tragic $51,168 |
| Cape Verdeans | 3.5 /100 | #234 | Tragic $51,103 |
| Immigrants | Western Africa | 3.0 /100 | #235 | Tragic $50,940 |
| Pennsylvania Germans | 2.8 /100 | #236 | Tragic $50,878 |
| Immigrants | Barbados | 2.6 /100 | #237 | Tragic $50,795 |
Demographics Similar to Poles by Median Male Earnings
In terms of median male earnings, the demographic groups most similar to Poles are Armenian ($58,134, a difference of 0.010%), Immigrants from Western Asia ($58,131, a difference of 0.020%), Syrian ($58,187, a difference of 0.080%), Immigrants from Northern Africa ($58,008, a difference of 0.23%), and Serbian ($57,975, a difference of 0.28%).
| Demographics | Rating | Rank | Median Male Earnings |
| Albanians | 98.4 /100 | #96 | Exceptional $58,680 |
| Northern Europeans | 98.2 /100 | #97 | Exceptional $58,588 |
| Jordanians | 98.1 /100 | #98 | Exceptional $58,500 |
| Immigrants | Poland | 98.0 /100 | #99 | Exceptional $58,452 |
| Assyrians/Chaldeans/Syriacs | 97.9 /100 | #100 | Exceptional $58,437 |
| Immigrants | Brazil | 97.7 /100 | #101 | Exceptional $58,324 |
| Syrians | 97.4 /100 | #102 | Exceptional $58,187 |
| Poles | 97.3 /100 | #103 | Exceptional $58,139 |
| Armenians | 97.3 /100 | #104 | Exceptional $58,134 |
| Immigrants | Western Asia | 97.3 /100 | #105 | Exceptional $58,131 |
| Immigrants | Northern Africa | 96.9 /100 | #106 | Exceptional $58,008 |
| Serbians | 96.8 /100 | #107 | Exceptional $57,975 |
| Immigrants | Uzbekistan | 96.7 /100 | #108 | Exceptional $57,941 |
| British | 96.5 /100 | #109 | Exceptional $57,890 |
| Palestinians | 96.2 /100 | #110 | Exceptional $57,778 |