Immigrants from Southern Europe vs Albanian Currently Married
COMPARE
Immigrants from Southern Europe
Albanian
Currently Married
Currently Married Comparison
Immigrants from Southern Europe
Albanians
46.9%
CURRENTLY MARRIED
65.9/ 100
METRIC RATING
161st/ 347
METRIC RANK
47.0%
CURRENTLY MARRIED
68.6/ 100
METRIC RATING
154th/ 347
METRIC RANK
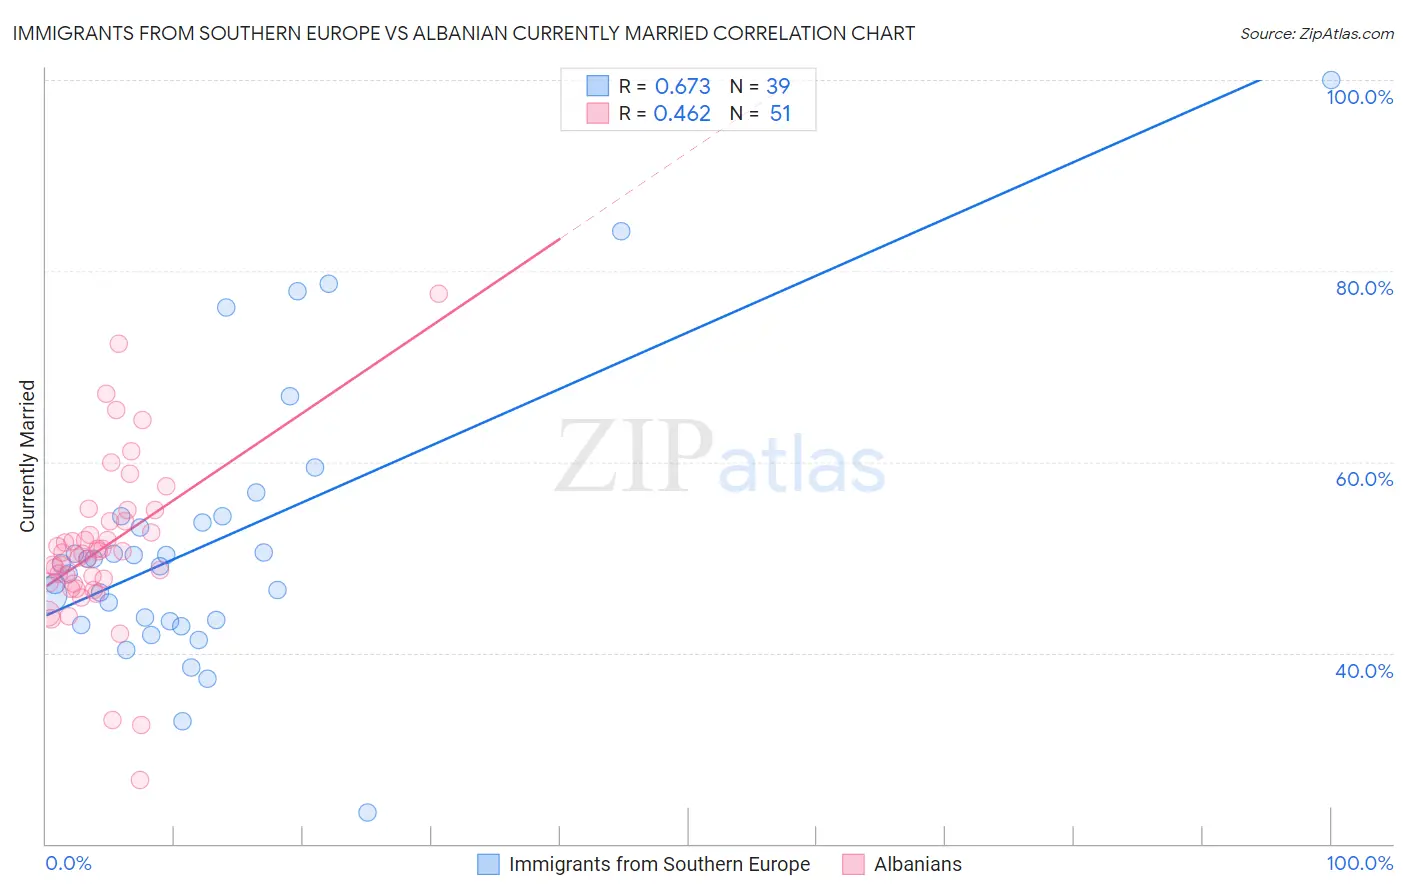
Immigrants from Southern Europe vs Albanian Currently Married Correlation Chart
The statistical analysis conducted on geographies consisting of 402,740,991 people shows a significant positive correlation between the proportion of Immigrants from Southern Europe and percentage of population currently married in the United States with a correlation coefficient (R) of 0.673 and weighted average of 46.9%. Similarly, the statistical analysis conducted on geographies consisting of 193,235,745 people shows a moderate positive correlation between the proportion of Albanians and percentage of population currently married in the United States with a correlation coefficient (R) of 0.462 and weighted average of 47.0%, a difference of 0.11%.
Currently Married Correlation Summary
| Measurement | Immigrants from Southern Europe | Albanian |
| Minimum | 23.3% | 26.7% |
| Maximum | 100.0% | 77.6% |
| Range | 76.7% | 50.9% |
| Mean | 51.7% | 51.0% |
| Median | 49.3% | 50.5% |
| Interquartile 25% (IQ1) | 43.3% | 47.2% |
| Interquartile 75% (IQ3) | 54.2% | 53.7% |
| Interquartile Range (IQR) | 10.9% | 6.5% |
| Standard Deviation (Sample) | 14.7% | 8.8% |
| Standard Deviation (Population) | 14.5% | 8.7% |
Demographics Similar to Immigrants from Southern Europe and Albanians by Currently Married
In terms of currently married, the demographic groups most similar to Immigrants from Southern Europe are Immigrants from Uzbekistan (46.9%, a difference of 0.0%), Iraqi (46.9%, a difference of 0.020%), Nonimmigrants (46.9%, a difference of 0.020%), Cherokee (46.9%, a difference of 0.030%), and Delaware (46.9%, a difference of 0.050%). Similarly, the demographic groups most similar to Albanians are Immigrants from Venezuela (47.0%, a difference of 0.0%), Arab (47.0%, a difference of 0.0%), Immigrants from Serbia (47.0%, a difference of 0.010%), Spanish (47.0%, a difference of 0.020%), and Immigrants from Switzerland (46.9%, a difference of 0.030%).
| Demographics | Rating | Rank | Currently Married |
| Immigrants | Argentina | 72.0 /100 | #147 | Good 47.0% |
| Cambodians | 70.4 /100 | #148 | Good 47.0% |
| Zimbabweans | 70.1 /100 | #149 | Good 47.0% |
| Immigrants | Turkey | 70.0 /100 | #150 | Good 47.0% |
| Chileans | 69.8 /100 | #151 | Good 47.0% |
| Immigrants | Serbia | 68.8 /100 | #152 | Good 47.0% |
| Immigrants | Venezuela | 68.6 /100 | #153 | Good 47.0% |
| Albanians | 68.6 /100 | #154 | Good 47.0% |
| Arabs | 68.6 /100 | #155 | Good 47.0% |
| Spanish | 68.1 /100 | #156 | Good 47.0% |
| Immigrants | Switzerland | 67.8 /100 | #157 | Good 46.9% |
| Cherokee | 66.8 /100 | #158 | Good 46.9% |
| Iraqis | 66.4 /100 | #159 | Good 46.9% |
| Immigrants | Uzbekistan | 66.0 /100 | #160 | Good 46.9% |
| Immigrants | Southern Europe | 65.9 /100 | #161 | Good 46.9% |
| Immigrants | Nonimmigrants | 65.4 /100 | #162 | Good 46.9% |
| Delaware | 64.7 /100 | #163 | Good 46.9% |
| Immigrants | Western Asia | 64.2 /100 | #164 | Good 46.9% |
| Samoans | 59.8 /100 | #165 | Average 46.8% |
| Immigrants | Syria | 59.3 /100 | #166 | Average 46.8% |
| Spaniards | 58.8 /100 | #167 | Average 46.8% |