Immigrants from Denmark vs Immigrants from Barbados Householder Income Ages 25 - 44 years
COMPARE
Immigrants from Denmark
Immigrants from Barbados
Householder Income Ages 25 - 44 years
Householder Income Ages 25 - 44 years Comparison
Immigrants from Denmark
Immigrants from Barbados
$110,363
HOUSEHOLDER INCOME AGES 25 - 44 YEARS
100.0/ 100
METRIC RATING
28th/ 347
METRIC RANK
$88,687
HOUSEHOLDER INCOME AGES 25 - 44 YEARS
3.7/ 100
METRIC RATING
229th/ 347
METRIC RANK
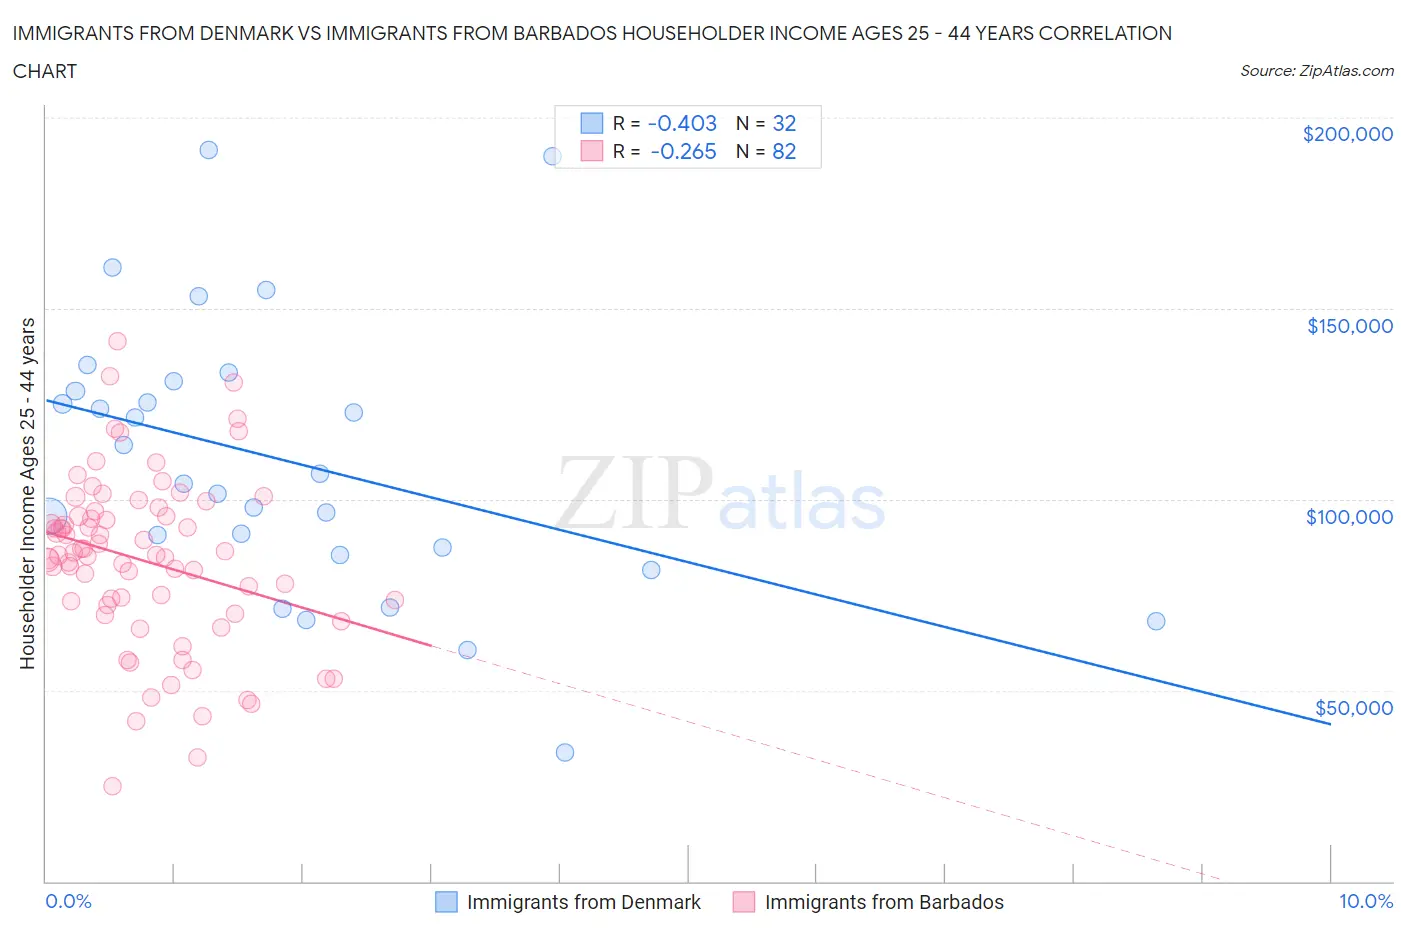
Immigrants from Denmark vs Immigrants from Barbados Householder Income Ages 25 - 44 years Correlation Chart
The statistical analysis conducted on geographies consisting of 136,144,868 people shows a moderate negative correlation between the proportion of Immigrants from Denmark and household income with householder between the ages 25 and 44 in the United States with a correlation coefficient (R) of -0.403 and weighted average of $110,363. Similarly, the statistical analysis conducted on geographies consisting of 112,714,156 people shows a weak negative correlation between the proportion of Immigrants from Barbados and household income with householder between the ages 25 and 44 in the United States with a correlation coefficient (R) of -0.265 and weighted average of $88,687, a difference of 24.4%.
Householder Income Ages 25 - 44 years Correlation Summary
| Measurement | Immigrants from Denmark | Immigrants from Barbados |
| Minimum | $33,654 | $24,836 |
| Maximum | $191,526 | $141,528 |
| Range | $157,872 | $116,692 |
| Mean | $110,073 | $83,858 |
| Median | $105,310 | $85,381 |
| Interquartile 25% (IQ1) | $86,395 | $72,198 |
| Interquartile 75% (IQ3) | $129,725 | $95,727 |
| Interquartile Range (IQR) | $43,330 | $23,529 |
| Standard Deviation (Sample) | $36,128 | $22,403 |
| Standard Deviation (Population) | $35,559 | $22,266 |
Similar Demographics by Householder Income Ages 25 - 44 years
Demographics Similar to Immigrants from Denmark by Householder Income Ages 25 - 44 years
In terms of householder income ages 25 - 44 years, the demographic groups most similar to Immigrants from Denmark are Russian ($110,398, a difference of 0.030%), Turkish ($110,318, a difference of 0.040%), Immigrants from Greece ($110,103, a difference of 0.24%), Maltese ($110,064, a difference of 0.27%), and Immigrants from Asia ($110,787, a difference of 0.38%).
| Demographics | Rating | Rank | Householder Income Ages 25 - 44 years |
| Asians | 100.0 /100 | #21 | Exceptional $112,666 |
| Immigrants | Belgium | 100.0 /100 | #22 | Exceptional $112,575 |
| Immigrants | Japan | 100.0 /100 | #23 | Exceptional $112,228 |
| Immigrants | Sweden | 100.0 /100 | #24 | Exceptional $112,010 |
| Immigrants | Northern Europe | 100.0 /100 | #25 | Exceptional $111,676 |
| Immigrants | Asia | 100.0 /100 | #26 | Exceptional $110,787 |
| Russians | 100.0 /100 | #27 | Exceptional $110,398 |
| Immigrants | Denmark | 100.0 /100 | #28 | Exceptional $110,363 |
| Turks | 100.0 /100 | #29 | Exceptional $110,318 |
| Immigrants | Greece | 100.0 /100 | #30 | Exceptional $110,103 |
| Maltese | 100.0 /100 | #31 | Exceptional $110,064 |
| Immigrants | Sri Lanka | 100.0 /100 | #32 | Exceptional $109,741 |
| Bhutanese | 100.0 /100 | #33 | Exceptional $109,520 |
| Bolivians | 100.0 /100 | #34 | Exceptional $109,372 |
| Immigrants | Switzerland | 100.0 /100 | #35 | Exceptional $109,185 |
Demographics Similar to Immigrants from Barbados by Householder Income Ages 25 - 44 years
In terms of householder income ages 25 - 44 years, the demographic groups most similar to Immigrants from Barbados are Immigrants from Bosnia and Herzegovina ($88,819, a difference of 0.15%), Immigrants from St. Vincent and the Grenadines ($88,888, a difference of 0.23%), Alaskan Athabascan ($88,446, a difference of 0.27%), Immigrants from Grenada ($88,311, a difference of 0.43%), and Nonimmigrants ($88,301, a difference of 0.44%).
| Demographics | Rating | Rank | Householder Income Ages 25 - 44 years |
| Immigrants | Ecuador | 6.2 /100 | #222 | Tragic $89,673 |
| Immigrants | Guyana | 5.9 /100 | #223 | Tragic $89,586 |
| Barbadians | 5.9 /100 | #224 | Tragic $89,565 |
| Immigrants | Panama | 5.5 /100 | #225 | Tragic $89,451 |
| Immigrants | Iraq | 5.5 /100 | #226 | Tragic $89,444 |
| Immigrants | St. Vincent and the Grenadines | 4.1 /100 | #227 | Tragic $88,888 |
| Immigrants | Bosnia and Herzegovina | 4.0 /100 | #228 | Tragic $88,819 |
| Immigrants | Barbados | 3.7 /100 | #229 | Tragic $88,687 |
| Alaskan Athabascans | 3.3 /100 | #230 | Tragic $88,446 |
| Immigrants | Grenada | 3.0 /100 | #231 | Tragic $88,311 |
| Immigrants | Nonimmigrants | 3.0 /100 | #232 | Tragic $88,301 |
| Malaysians | 3.0 /100 | #233 | Tragic $88,291 |
| Venezuelans | 2.9 /100 | #234 | Tragic $88,232 |
| Bermudans | 2.9 /100 | #235 | Tragic $88,231 |
| Immigrants | Cameroon | 2.9 /100 | #236 | Tragic $88,214 |