Immigrants from South Africa vs Honduran Householder Income Over 65 years

COMPARE

Immigrants from South Africa
Race
Ancestry
AfghanAfricanAlaska NativeAlaskan AthabascanAlbanianAleutAlsatianAmericanApacheArabArapahoArgentineanArmenianAssyrian/Chaldean/SyriacAustralianAustrianBahamianBangladeshiBarbadianBasqueBelgianBelizeanBermudanBhutaneseBlackfeetBolivianBrazilianBritishBritish West IndianBulgarianBurmeseCajunCambodianCanadianCape VerdeanCarpatho RusynCelticCentral AmericanCentral American IndianCherokeeCheyenneChickasawChileanChineseChippewaChoctawColombianColvilleComancheCosta RicanCreeCreekCroatianCrowCubanCypriotCzechCzechoslovakianDanishDelawareDominicanDutchDutch West IndianEastern EuropeanEcuadorianEgyptianEnglishEstonianEthiopianEuropeanFijianFilipinoFinnishFrenchFrench American IndianFrench CanadianGermanGerman RussianGhanaianGreekGuamanian/ChamorroGuatemalanGuyaneseHaitianHmongHopiHoumaHungarianIcelanderIndian (Asian)IndonesianInupiatIranianIraqiIrishIroquoisIsraeliItalianJamaicanJapaneseJordanianKenyanKiowaKoreanLaotianLatvianLebaneseLiberianLithuanianLumbeeLuxembourgerMacedonianMalaysianMalteseMarshalleseMenomineeMexicanMexican American IndianMongolianMoroccanNative HawaiianNavajoNepaleseNew ZealanderNicaraguanNigerianNorthern EuropeanNorwegianOkinawanOsageOttawaPaiutePakistaniPalestinianPanamanianParaguayanPennsylvania GermanPeruvianPimaPolishPortuguesePotawatomiPuebloPuerto RicanPuget Sound SalishRomanianRussianSalvadoranSamoanScandinavianScotch-IrishScottishSeminoleSenegaleseSerbianShoshoneSierra LeoneanSiouxSlavicSlovakSloveneSomaliSouth AfricanSouth AmericanSouth American IndianSoviet UnionSpaniardSpanishSpanish AmericanSpanish American IndianSri LankanSubsaharan AfricanSudaneseSwedishSwissSyrianTaiwaneseThaiTlingit-HaidaTohono O'OdhamTonganTrinidadian and TobagonianTsimshianTurkishU.S. Virgin IslanderUgandanUkrainianUruguayanUteVenezuelanVietnameseWelshWest IndianYakamaYaquiYugoslavianYumanYup'ikZimbabwean
Immigration
NonimmigrantsImmigrantsAfghanistanAfricaAlbaniaArgentinaArmeniaAsiaAustraliaAustriaBahamasBangladeshBarbadosBelarusBelgiumBelizeBoliviaBosnia and HerzegovinaBrazilBulgariaBurma/MyanmarCabo VerdeCambodiaCameroonCanadaCaribbeanCentral AmericaChileChinaColombiaCongoCosta RicaCroatiaCubaCzechoslovakiaDenmarkDominicaDominican RepublicEastern AfricaEastern AsiaEastern EuropeEcuadorEgyptEl SalvadorEnglandEritreaEthiopiaEuropeFijiFranceGermanyGhanaGreeceGrenadaGuatemalaGuyanaHaitiHondurasHong KongHungaryIndiaIndonesiaIranIraqIrelandIsraelItalyJamaicaJapanJordanKazakhstanKenyaKoreaKuwaitLaosLatin AmericaLatviaLebanonLiberiaLithuaniaMalaysiaMexicoMicronesiaMiddle AfricaMoldovaMoroccoNepalNetherlandsNicaraguaNigeriaNorth AmericaNorth MacedoniaNorthern AfricaNorthern EuropeNorwayOceaniaPakistanPanamaPeruPhilippinesPolandPortugalRomaniaRussiaSaudi ArabiaScotlandSenegalSerbiaSierra LeoneSingaporeSomaliaSouth AfricaSouth AmericaSouth Central AsiaSouth Eastern AsiaSouthern EuropeSpainSri LankaSt. Vincent and the GrenadinesSudanSwedenSwitzerlandSyriaTaiwanThailandTrinidad and TobagoTurkeyUgandaUkraineUruguayUzbekistanVenezuelaVietnamWest IndiesWestern AfricaWestern AsiaWestern EuropeYemenZaireZimbabweAzores
Honduran
Race
Ancestry
AfghanAfricanAlaska NativeAlaskan AthabascanAlbanianAleutAlsatianAmericanApacheArabArapahoArgentineanArmenianAssyrian/Chaldean/SyriacAustralianAustrianBahamianBangladeshiBarbadianBasqueBelgianBelizeanBermudanBhutaneseBlackfeetBolivianBrazilianBritishBritish West IndianBulgarianBurmeseCajunCambodianCanadianCape VerdeanCarpatho RusynCelticCentral AmericanCentral American IndianCherokeeCheyenneChickasawChileanChineseChippewaChoctawColombianColvilleComancheCosta RicanCreeCreekCroatianCrowCubanCypriotCzechCzechoslovakianDanishDelawareDominicanDutchDutch West IndianEastern EuropeanEcuadorianEgyptianEnglishEstonianEthiopianEuropeanFijianFilipinoFinnishFrenchFrench American IndianFrench CanadianGermanGerman RussianGhanaianGreekGuamanian/ChamorroGuatemalanGuyaneseHaitianHmongHonduranHopiHoumaHungarianIcelanderIndian (Asian)IndonesianInupiatIranianIraqiIrishIroquoisIsraeliItalianJamaicanJapaneseJordanianKenyanKiowaKoreanLaotianLatvianLebaneseLiberianLithuanianLumbeeLuxembourgerMacedonianMalaysianMalteseMarshalleseMenomineeMexicanMexican American IndianMongolianMoroccanNative HawaiianNavajoNepaleseNew ZealanderNicaraguanNigerianNorthern EuropeanNorwegianOkinawanOsageOttawaPaiutePakistaniPalestinianPanamanianParaguayanPennsylvania GermanPeruvianPimaPolishPortuguesePotawatomiPuebloPuerto RicanPuget Sound SalishRomanianRussianSalvadoranSamoanScandinavianScotch-IrishScottishSeminoleSenegaleseSerbianShoshoneSierra LeoneanSiouxSlavicSlovakSloveneSomaliSouth AfricanSouth AmericanSouth American IndianSoviet UnionSpaniardSpanishSpanish AmericanSpanish American IndianSri LankanSubsaharan AfricanSudaneseSwedishSwissSyrianTaiwaneseThaiTlingit-HaidaTohono O'OdhamTonganTrinidadian and TobagonianTsimshianTurkishU.S. Virgin IslanderUgandanUkrainianUruguayanUteVenezuelanVietnameseWelshWest IndianYakamaYaquiYugoslavianYumanYup'ikZimbabwean
Immigration
NonimmigrantsImmigrantsAfghanistanAfricaAlbaniaArgentinaArmeniaAsiaAustraliaAustriaBahamasBangladeshBarbadosBelarusBelgiumBelizeBoliviaBosnia and HerzegovinaBrazilBulgariaBurma/MyanmarCabo VerdeCambodiaCameroonCanadaCaribbeanCentral AmericaChileChinaColombiaCongoCosta RicaCroatiaCubaCzechoslovakiaDenmarkDominicaDominican RepublicEastern AfricaEastern AsiaEastern EuropeEcuadorEgyptEl SalvadorEnglandEritreaEthiopiaEuropeFijiFranceGermanyGhanaGreeceGrenadaGuatemalaGuyanaHaitiHondurasHong KongHungaryIndiaIndonesiaIranIraqIrelandIsraelItalyJamaicaJapanJordanKazakhstanKenyaKoreaKuwaitLaosLatin AmericaLatviaLebanonLiberiaLithuaniaMalaysiaMexicoMicronesiaMiddle AfricaMoldovaMoroccoNepalNetherlandsNicaraguaNigeriaNorth AmericaNorth MacedoniaNorthern AfricaNorthern EuropeNorwayOceaniaPakistanPanamaPeruPhilippinesPolandPortugalRomaniaRussiaSaudi ArabiaScotlandSenegalSerbiaSierra LeoneSingaporeSomaliaSouth AmericaSouth Central AsiaSouth Eastern AsiaSouthern EuropeSpainSri LankaSt. Vincent and the GrenadinesSudanSwedenSwitzerlandSyriaTaiwanThailandTrinidad and TobagoTurkeyUgandaUkraineUruguayUzbekistanVenezuelaVietnamWest IndiesWestern AfricaWestern AsiaWestern EuropeYemenZaireZimbabweAzores
Householder Income Over 65 years
Income
Poverty
Unemployment
Labor Participation
Family Structure
Vehicle Availability
Education Level
Disability

Householder Income Over 65 years Comparison

Immigrants from South Africa

Hondurans

Exceptional
Tragic
$67,234
HOUSEHOLDER INCOME OVER 65 YEARS
99.9/ 100
METRIC RATING
44th/ 347
METRIC RANK
$52,634
HOUSEHOLDER INCOME OVER 65 YEARS
0.0/ 100
METRIC RATING
309th/ 347
METRIC RANK

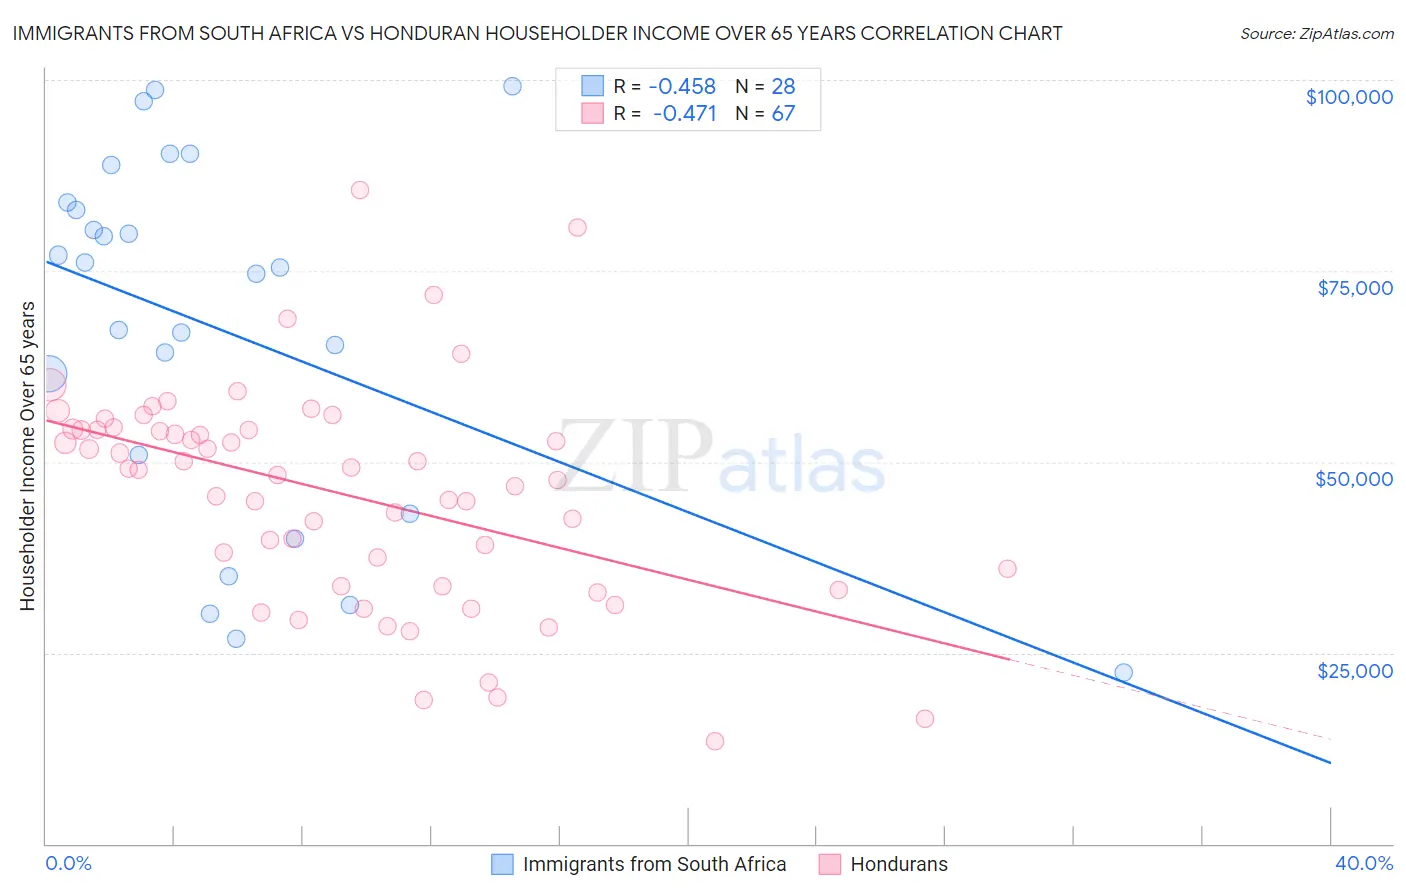
Immigrants from South Africa vs Honduran Householder Income Over 65 years Correlation Chart

The statistical analysis conducted on geographies consisting of 232,954,007 people shows a moderate negative correlation between the proportion of Immigrants from South Africa and household income with householder over the age of 65 in the United States with a correlation coefficient (R) of -0.458 and weighted average of $67,234. Similarly, the statistical analysis conducted on geographies consisting of 356,652,935 people shows a moderate negative correlation between the proportion of Hondurans and household income with householder over the age of 65 in the United States with a correlation coefficient (R) of -0.471 and weighted average of $52,634, a difference of 27.7%.
Immigrants from South Africa vs Honduran Householder Income Over 65 years

Householder Income Over 65 years Correlation Summary

MeasurementImmigrants from South AfricaHonduran
Minimum$22,500$13,371
Maximum$99,125$85,625
Range$76,625$72,254
Mean$67,143$45,868
Median$74,972$48,924
Interquartile 25% (IQ1)$47,057$33,750
Interquartile 75% (IQ3)$83,529$54,223
Interquartile Range (IQR)$36,471$20,473
Standard Deviation (Sample)$23,355$14,320
Standard Deviation (Population)$22,935$14,213

Similar Demographics by Householder Income Over 65 years

Demographics Similar to Immigrants from South Africa by Householder Income Over 65 years

In terms of householder income over 65 years, the demographic groups most similar to Immigrants from South Africa are Latvian ($67,326, a difference of 0.14%), New Zealander ($67,333, a difference of 0.15%), Immigrants from Afghanistan ($67,007, a difference of 0.34%), Korean ($67,472, a difference of 0.35%), and Cambodian ($66,892, a difference of 0.51%).
DemographicsRating | RankHouseholder Income Over 65 years
Turks
99.9
/100
|
#37
Exceptional
$68,037
Estonians
99.9
/100
|
#38
Exceptional
$67,926
Russians
99.9
/100
|
#39
Exceptional
$67,626
Immigrants | Asia
99.9
/100
|
#40
Exceptional
$67,594
Koreans
99.9
/100
|
#41
Exceptional
$67,472
New Zealanders
99.9
/100
|
#42
Exceptional
$67,333
Latvians
99.9
/100
|
#43
Exceptional
$67,326
Immigrants | South Africa
99.9
/100
|
#44
Exceptional
$67,234
Immigrants | Afghanistan
99.8
/100
|
#45
Exceptional
$67,007
Cambodians
99.8
/100
|
#46
Exceptional
$66,892
Australians
99.8
/100
|
#47
Exceptional
$66,891
Immigrants | France
99.8
/100
|
#48
Exceptional
$66,826
Immigrants | Indonesia
99.8
/100
|
#49
Exceptional
$66,694
Immigrants | Turkey
99.7
/100
|
#50
Exceptional
$66,672
Israelis
99.7
/100
|
#51
Exceptional
$66,636

Demographics Similar to Hondurans by Householder Income Over 65 years

In terms of householder income over 65 years, the demographic groups most similar to Hondurans are Sioux ($52,509, a difference of 0.24%), Immigrants from Mexico ($52,801, a difference of 0.32%), Hispanic or Latino ($52,832, a difference of 0.38%), Pennsylvania German ($52,888, a difference of 0.48%), and Seminole ($52,373, a difference of 0.50%).
DemographicsRating | RankHouseholder Income Over 65 years
Spanish American Indians
0.0
/100
|
#302
Tragic
$53,077
Choctaw
0.0
/100
|
#303
Tragic
$53,060
Ute
0.0
/100
|
#304
Tragic
$52,949
Pueblo
0.0
/100
|
#305
Tragic
$52,930
Pennsylvania Germans
0.0
/100
|
#306
Tragic
$52,888
Hispanics or Latinos
0.0
/100
|
#307
Tragic
$52,832
Immigrants | Mexico
0.0
/100
|
#308
Tragic
$52,801
Hondurans
0.0
/100
|
#309
Tragic
$52,634
Sioux
0.0
/100
|
#310
Tragic
$52,509
Seminole
0.0
/100
|
#311
Tragic
$52,373
Immigrants | Azores
0.0
/100
|
#312
Tragic
$52,121
Immigrants | Nicaragua
0.0
/100
|
#313
Tragic
$52,085
Natives/Alaskans
0.0
/100
|
#314
Tragic
$52,081
U.S. Virgin Islanders
0.0
/100
|
#315
Tragic
$52,072
Creek
0.0
/100
|
#316
Tragic
$51,949