Taiwanese vs Moroccan Median Male Earnings
COMPARE
Taiwanese
Moroccan
Median Male Earnings
Median Male Earnings Comparison
Taiwanese
Moroccans
$55,556
MEDIAN MALE EARNINGS
73.9/ 100
METRIC RATING
154th/ 347
METRIC RANK
$56,499
MEDIAN MALE EARNINGS
87.7/ 100
METRIC RATING
134th/ 347
METRIC RANK
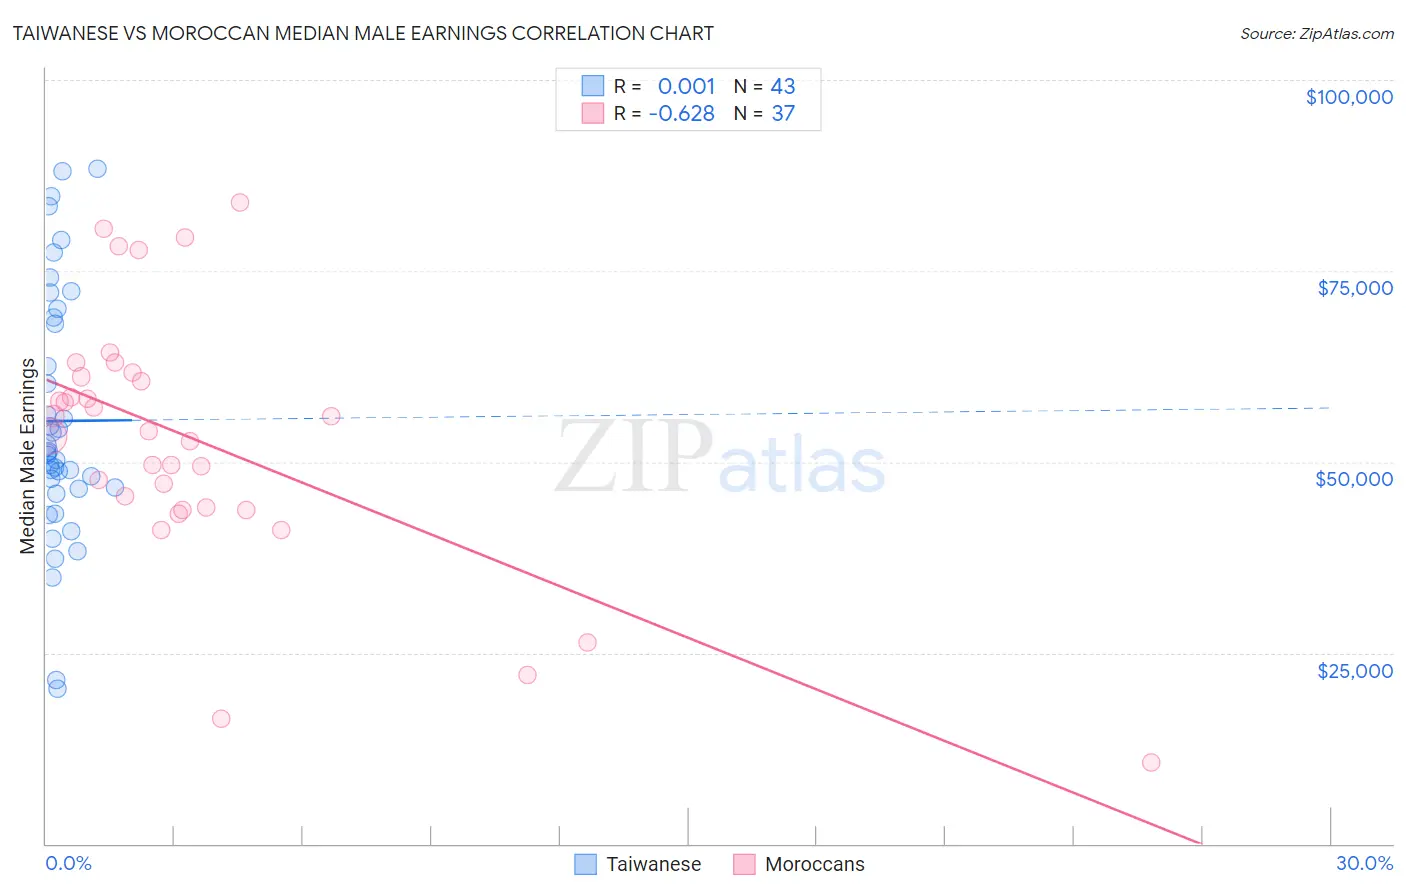
Taiwanese vs Moroccan Median Male Earnings Correlation Chart
The statistical analysis conducted on geographies consisting of 31,719,634 people shows no correlation between the proportion of Taiwanese and median male earnings in the United States with a correlation coefficient (R) of 0.001 and weighted average of $55,556. Similarly, the statistical analysis conducted on geographies consisting of 201,785,575 people shows a significant negative correlation between the proportion of Moroccans and median male earnings in the United States with a correlation coefficient (R) of -0.628 and weighted average of $56,499, a difference of 1.7%.
Median Male Earnings Correlation Summary
| Measurement | Taiwanese | Moroccan |
| Minimum | $20,367 | $10,662 |
| Maximum | $88,333 | $84,023 |
| Range | $67,966 | $73,361 |
| Mean | $55,357 | $52,885 |
| Median | $51,283 | $54,008 |
| Interquartile 25% (IQ1) | $46,547 | $43,924 |
| Interquartile 75% (IQ3) | $68,930 | $61,434 |
| Interquartile Range (IQR) | $22,384 | $17,511 |
| Standard Deviation (Sample) | $16,341 | $16,590 |
| Standard Deviation (Population) | $16,149 | $16,364 |
Demographics Similar to Taiwanese and Moroccans by Median Male Earnings
In terms of median male earnings, the demographic groups most similar to Taiwanese are Immigrants from Nepal ($55,615, a difference of 0.11%), Peruvian ($55,659, a difference of 0.19%), Immigrants from Oceania ($55,712, a difference of 0.28%), Swiss ($55,731, a difference of 0.32%), and English ($55,747, a difference of 0.34%). Similarly, the demographic groups most similar to Moroccans are Irish ($56,464, a difference of 0.060%), Immigrants from Saudi Arabia ($56,452, a difference of 0.080%), Slavic ($56,390, a difference of 0.19%), Slovak ($56,306, a difference of 0.34%), and Zimbabwean ($56,302, a difference of 0.35%).
| Demographics | Rating | Rank | Median Male Earnings |
| Moroccans | 87.7 /100 | #134 | Excellent $56,499 |
| Irish | 87.4 /100 | #135 | Excellent $56,464 |
| Immigrants | Saudi Arabia | 87.2 /100 | #136 | Excellent $56,452 |
| Slavs | 86.5 /100 | #137 | Excellent $56,390 |
| Slovaks | 85.5 /100 | #138 | Excellent $56,306 |
| Zimbabweans | 85.5 /100 | #139 | Excellent $56,302 |
| Luxembourgers | 85.5 /100 | #140 | Excellent $56,300 |
| Danes | 84.8 /100 | #141 | Excellent $56,246 |
| Ethiopians | 84.8 /100 | #142 | Excellent $56,243 |
| Sri Lankans | 83.4 /100 | #143 | Excellent $56,136 |
| Immigrants | Uganda | 82.4 /100 | #144 | Excellent $56,064 |
| Norwegians | 80.9 /100 | #145 | Excellent $55,965 |
| Immigrants | Chile | 80.7 /100 | #146 | Excellent $55,954 |
| Immigrants | Philippines | 78.4 /100 | #147 | Good $55,809 |
| Scottish | 78.2 /100 | #148 | Good $55,793 |
| English | 77.4 /100 | #149 | Good $55,747 |
| Swiss | 77.1 /100 | #150 | Good $55,731 |
| Immigrants | Oceania | 76.8 /100 | #151 | Good $55,712 |
| Peruvians | 75.8 /100 | #152 | Good $55,659 |
| Immigrants | Nepal | 75.0 /100 | #153 | Good $55,615 |
| Taiwanese | 73.9 /100 | #154 | Good $55,556 |