Immigrants from Somalia vs Immigrants Median Household Income
COMPARE
Immigrants from Somalia
Immigrants
Median Household Income
Median Household Income Comparison
Immigrants from Somalia
Immigrants
$74,300
MEDIAN HOUSEHOLD INCOME
0.1/ 100
METRIC RATING
286th/ 347
METRIC RANK
$85,818
MEDIAN HOUSEHOLD INCOME
61.3/ 100
METRIC RATING
167th/ 347
METRIC RANK
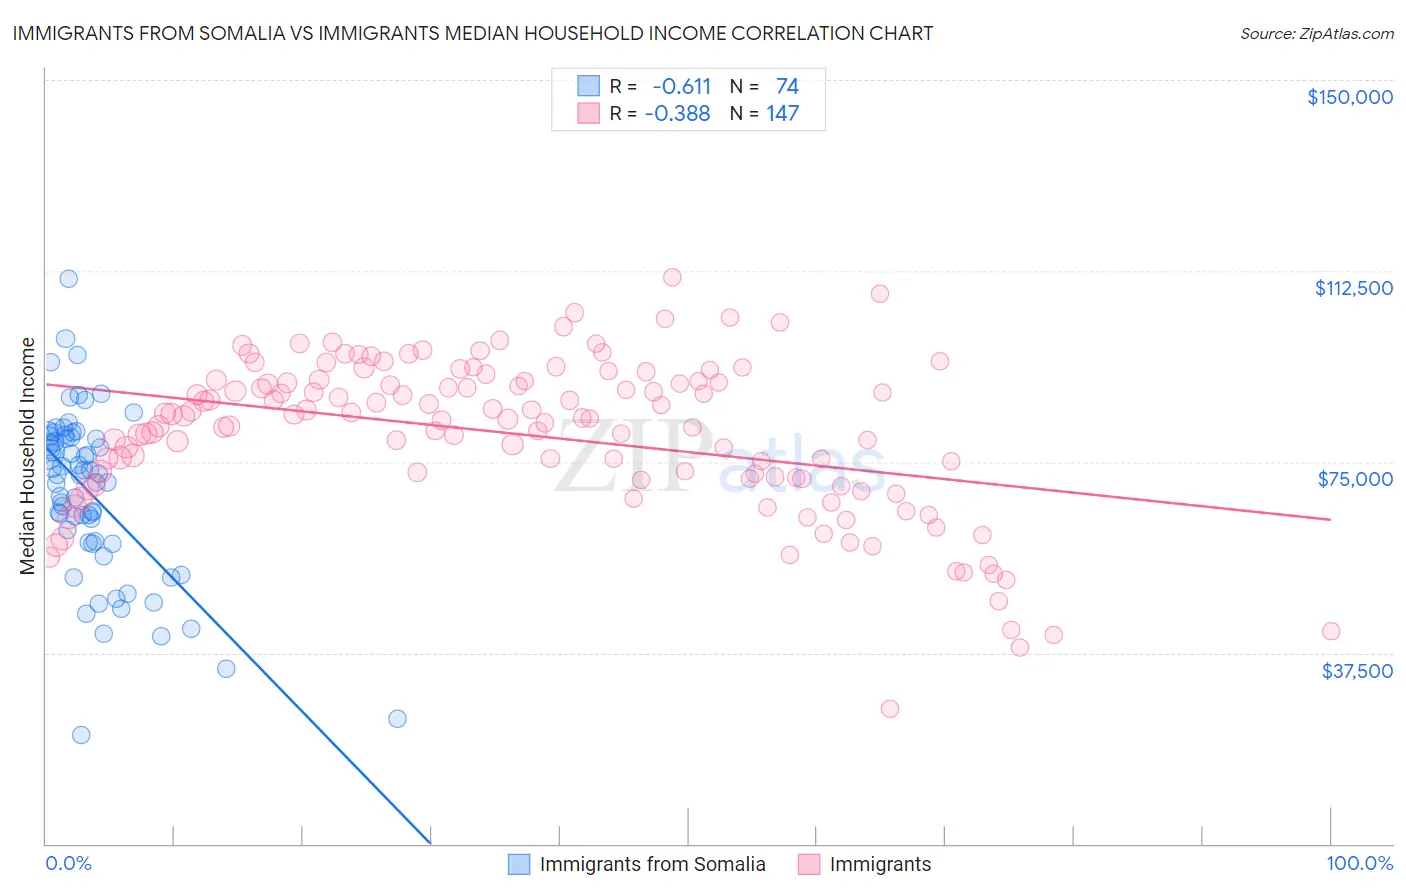
Immigrants from Somalia vs Immigrants Median Household Income Correlation Chart
The statistical analysis conducted on geographies consisting of 92,093,487 people shows a significant negative correlation between the proportion of Immigrants from Somalia and median household income in the United States with a correlation coefficient (R) of -0.611 and weighted average of $74,300. Similarly, the statistical analysis conducted on geographies consisting of 575,988,831 people shows a mild negative correlation between the proportion of Immigrants and median household income in the United States with a correlation coefficient (R) of -0.388 and weighted average of $85,818, a difference of 15.5%.
Median Household Income Correlation Summary
| Measurement | Immigrants from Somalia | Immigrants |
| Minimum | $21,288 | $26,558 |
| Maximum | $111,048 | $111,218 |
| Range | $89,760 | $84,660 |
| Mean | $68,739 | $80,268 |
| Median | $72,392 | $83,546 |
| Interquartile 25% (IQ1) | $59,132 | $71,664 |
| Interquartile 75% (IQ3) | $79,747 | $90,776 |
| Interquartile Range (IQR) | $20,615 | $19,112 |
| Standard Deviation (Sample) | $16,683 | $15,311 |
| Standard Deviation (Population) | $16,570 | $15,259 |
Similar Demographics by Median Household Income
Demographics Similar to Immigrants from Somalia by Median Household Income
In terms of median household income, the demographic groups most similar to Immigrants from Somalia are Iroquois ($74,279, a difference of 0.030%), Immigrants from Central America ($74,217, a difference of 0.11%), Mexican ($74,399, a difference of 0.13%), Fijian ($74,205, a difference of 0.13%), and Bangladeshi ($74,112, a difference of 0.25%).
| Demographics | Rating | Rank | Median Household Income |
| Immigrants | Guatemala | 0.2 /100 | #279 | Tragic $75,123 |
| Senegalese | 0.2 /100 | #280 | Tragic $74,999 |
| Immigrants | Liberia | 0.1 /100 | #281 | Tragic $74,896 |
| Central American Indians | 0.1 /100 | #282 | Tragic $74,847 |
| Cree | 0.1 /100 | #283 | Tragic $74,685 |
| Yaqui | 0.1 /100 | #284 | Tragic $74,596 |
| Mexicans | 0.1 /100 | #285 | Tragic $74,399 |
| Immigrants | Somalia | 0.1 /100 | #286 | Tragic $74,300 |
| Iroquois | 0.1 /100 | #287 | Tragic $74,279 |
| Immigrants | Central America | 0.1 /100 | #288 | Tragic $74,217 |
| Fijians | 0.1 /100 | #289 | Tragic $74,205 |
| Bangladeshis | 0.1 /100 | #290 | Tragic $74,112 |
| Hispanics or Latinos | 0.1 /100 | #291 | Tragic $73,823 |
| Comanche | 0.1 /100 | #292 | Tragic $73,747 |
| Immigrants | Cabo Verde | 0.1 /100 | #293 | Tragic $73,515 |
Demographics Similar to Immigrants by Median Household Income
In terms of median household income, the demographic groups most similar to Immigrants are Icelander ($85,797, a difference of 0.020%), Colombian ($85,716, a difference of 0.12%), Swiss ($85,681, a difference of 0.16%), Immigrants from South America ($85,611, a difference of 0.24%), and Scandinavian ($86,073, a difference of 0.30%).
| Demographics | Rating | Rank | Median Household Income |
| Luxembourgers | 70.0 /100 | #160 | Good $86,418 |
| Slavs | 69.7 /100 | #161 | Good $86,398 |
| Guamanians/Chamorros | 67.7 /100 | #162 | Good $86,255 |
| Czechs | 66.4 /100 | #163 | Good $86,164 |
| Irish | 66.2 /100 | #164 | Good $86,145 |
| Norwegians | 65.3 /100 | #165 | Good $86,084 |
| Scandinavians | 65.1 /100 | #166 | Good $86,073 |
| Immigrants | Immigrants | 61.3 /100 | #167 | Good $85,818 |
| Icelanders | 61.0 /100 | #168 | Good $85,797 |
| Colombians | 59.7 /100 | #169 | Average $85,716 |
| Swiss | 59.2 /100 | #170 | Average $85,681 |
| Immigrants | South America | 58.1 /100 | #171 | Average $85,611 |
| Slovenes | 57.4 /100 | #172 | Average $85,562 |
| Immigrants | Cameroon | 53.4 /100 | #173 | Average $85,314 |
| Scottish | 50.0 /100 | #174 | Average $85,101 |