Immigrants from Sierra Leone vs Chippewa Professional Degree
COMPARE
Immigrants from Sierra Leone
Chippewa
Professional Degree
Professional Degree Comparison
Immigrants from Sierra Leone
Chippewa
4.5%
PROFESSIONAL DEGREE
58.7/ 100
METRIC RATING
168th/ 347
METRIC RANK
3.5%
PROFESSIONAL DEGREE
0.3/ 100
METRIC RATING
290th/ 347
METRIC RANK
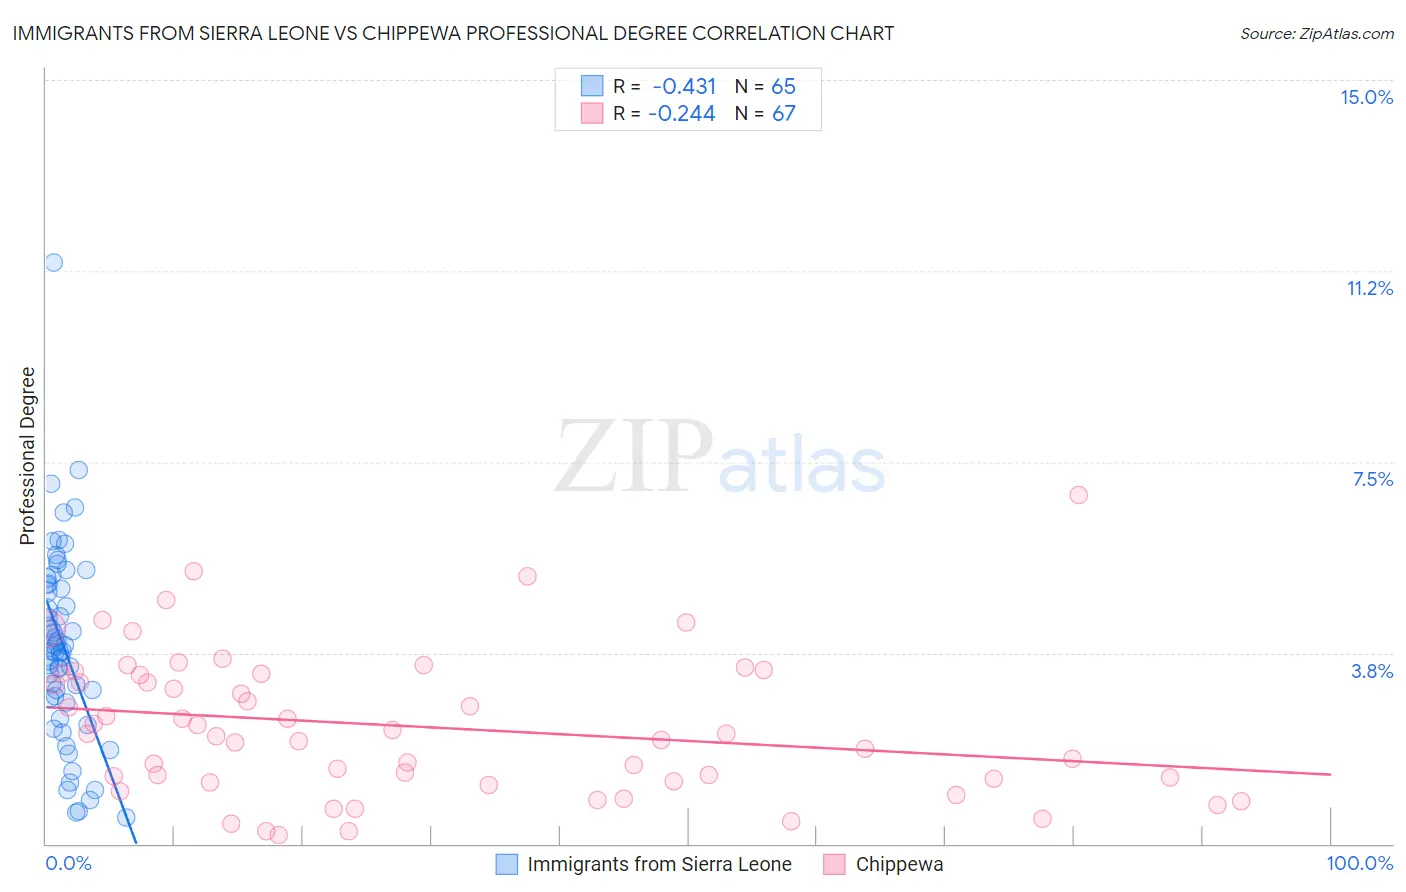
Immigrants from Sierra Leone vs Chippewa Professional Degree Correlation Chart
The statistical analysis conducted on geographies consisting of 101,572,134 people shows a moderate negative correlation between the proportion of Immigrants from Sierra Leone and percentage of population with at least professional degree education in the United States with a correlation coefficient (R) of -0.431 and weighted average of 4.5%. Similarly, the statistical analysis conducted on geographies consisting of 214,425,130 people shows a weak negative correlation between the proportion of Chippewa and percentage of population with at least professional degree education in the United States with a correlation coefficient (R) of -0.244 and weighted average of 3.5%, a difference of 28.7%.
Professional Degree Correlation Summary
| Measurement | Immigrants from Sierra Leone | Chippewa |
| Minimum | 0.52% | 0.17% |
| Maximum | 11.4% | 6.9% |
| Range | 10.9% | 6.7% |
| Mean | 3.9% | 2.3% |
| Median | 3.8% | 2.2% |
| Interquartile 25% (IQ1) | 2.8% | 1.2% |
| Interquartile 75% (IQ3) | 5.1% | 3.3% |
| Interquartile Range (IQR) | 2.3% | 2.1% |
| Standard Deviation (Sample) | 1.9% | 1.4% |
| Standard Deviation (Population) | 1.9% | 1.4% |
Similar Demographics by Professional Degree
Demographics Similar to Immigrants from Sierra Leone by Professional Degree
In terms of professional degree, the demographic groups most similar to Immigrants from Sierra Leone are Chinese (4.5%, a difference of 0.020%), Immigrants from Afghanistan (4.5%, a difference of 0.070%), Immigrants from Colombia (4.5%, a difference of 0.10%), Costa Rican (4.5%, a difference of 0.17%), and Immigrants from Zaire (4.5%, a difference of 0.19%).
| Demographics | Rating | Rank | Professional Degree |
| Assyrians/Chaldeans/Syriacs | 67.4 /100 | #161 | Good 4.5% |
| Peruvians | 65.2 /100 | #162 | Good 4.5% |
| Sierra Leoneans | 64.3 /100 | #163 | Good 4.5% |
| Swiss | 61.0 /100 | #164 | Good 4.5% |
| Costa Ricans | 59.9 /100 | #165 | Average 4.5% |
| Immigrants | Colombia | 59.4 /100 | #166 | Average 4.5% |
| Immigrants | Afghanistan | 59.2 /100 | #167 | Average 4.5% |
| Immigrants | Sierra Leone | 58.7 /100 | #168 | Average 4.5% |
| Chinese | 58.6 /100 | #169 | Average 4.5% |
| Immigrants | Zaire | 57.4 /100 | #170 | Average 4.5% |
| Immigrants | Bangladesh | 56.0 /100 | #171 | Average 4.4% |
| Spaniards | 52.0 /100 | #172 | Average 4.4% |
| English | 50.1 /100 | #173 | Average 4.4% |
| Kenyans | 50.0 /100 | #174 | Average 4.4% |
| Irish | 50.0 /100 | #175 | Average 4.4% |
Demographics Similar to Chippewa by Professional Degree
In terms of professional degree, the demographic groups most similar to Chippewa are Guatemalan (3.5%, a difference of 0.010%), Alaska Native (3.5%, a difference of 0.17%), Blackfeet (3.5%, a difference of 0.19%), Immigrants from El Salvador (3.5%, a difference of 0.23%), and Immigrants from Belize (3.5%, a difference of 0.24%).
| Demographics | Rating | Rank | Professional Degree |
| Comanche | 0.4 /100 | #283 | Tragic 3.5% |
| Salvadorans | 0.4 /100 | #284 | Tragic 3.5% |
| Hondurans | 0.3 /100 | #285 | Tragic 3.5% |
| Haitians | 0.3 /100 | #286 | Tragic 3.5% |
| Immigrants | El Salvador | 0.3 /100 | #287 | Tragic 3.5% |
| Blackfeet | 0.3 /100 | #288 | Tragic 3.5% |
| Guatemalans | 0.3 /100 | #289 | Tragic 3.5% |
| Chippewa | 0.3 /100 | #290 | Tragic 3.5% |
| Alaska Natives | 0.3 /100 | #291 | Tragic 3.5% |
| Immigrants | Belize | 0.3 /100 | #292 | Tragic 3.5% |
| Immigrants | Honduras | 0.3 /100 | #293 | Tragic 3.5% |
| Paiute | 0.3 /100 | #294 | Tragic 3.4% |
| Immigrants | Guatemala | 0.2 /100 | #295 | Tragic 3.4% |
| Hawaiians | 0.2 /100 | #296 | Tragic 3.4% |
| Immigrants | Liberia | 0.2 /100 | #297 | Tragic 3.4% |