Immigrants from Senegal vs U.S. Virgin Islander Householder Income Under 25 years
COMPARE
Immigrants from Senegal
U.S. Virgin Islander
Householder Income Under 25 years
Householder Income Under 25 years Comparison
Immigrants from Senegal
U.S. Virgin Islanders
$49,742
HOUSEHOLDER INCOME UNDER 25 YEARS
0.3/ 100
METRIC RATING
274th/ 347
METRIC RANK
$47,448
HOUSEHOLDER INCOME UNDER 25 YEARS
0.0/ 100
METRIC RATING
309th/ 347
METRIC RANK
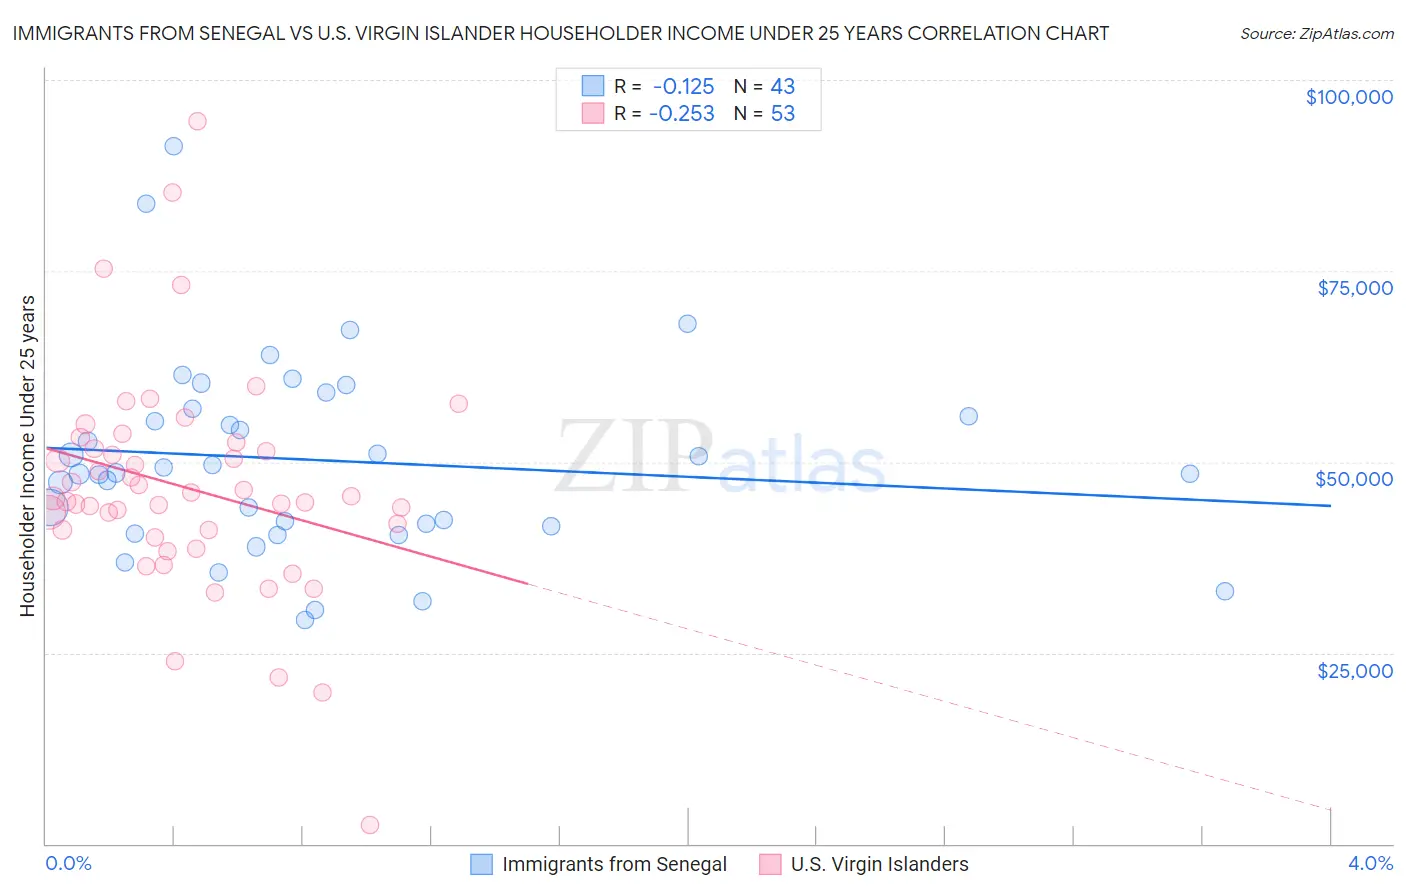
Immigrants from Senegal vs U.S. Virgin Islander Householder Income Under 25 years Correlation Chart
The statistical analysis conducted on geographies consisting of 85,448,384 people shows a poor negative correlation between the proportion of Immigrants from Senegal and household income with householder under the age of 25 in the United States with a correlation coefficient (R) of -0.125 and weighted average of $49,742. Similarly, the statistical analysis conducted on geographies consisting of 82,202,260 people shows a weak negative correlation between the proportion of U.S. Virgin Islanders and household income with householder under the age of 25 in the United States with a correlation coefficient (R) of -0.253 and weighted average of $47,448, a difference of 4.8%.
Householder Income Under 25 years Correlation Summary
| Measurement | Immigrants from Senegal | U.S. Virgin Islander |
| Minimum | $29,259 | $2,499 |
| Maximum | $91,404 | $94,615 |
| Range | $62,145 | $92,116 |
| Mean | $50,222 | $46,588 |
| Median | $48,557 | $45,199 |
| Interquartile 25% (IQ1) | $41,620 | $40,580 |
| Interquartile 75% (IQ3) | $56,900 | $52,169 |
| Interquartile Range (IQR) | $15,280 | $11,589 |
| Standard Deviation (Sample) | $12,847 | $14,716 |
| Standard Deviation (Population) | $12,697 | $14,577 |
Similar Demographics by Householder Income Under 25 years
Demographics Similar to Immigrants from Senegal by Householder Income Under 25 years
In terms of householder income under 25 years, the demographic groups most similar to Immigrants from Senegal are Slovak ($49,753, a difference of 0.020%), Colville ($49,774, a difference of 0.060%), Taiwanese ($49,804, a difference of 0.12%), Immigrants from Kenya ($49,633, a difference of 0.22%), and Dominican ($49,633, a difference of 0.22%).
| Demographics | Rating | Rank | Householder Income Under 25 years |
| Immigrants | Laos | 0.5 /100 | #267 | Tragic $50,041 |
| Venezuelans | 0.5 /100 | #268 | Tragic $50,011 |
| Ute | 0.5 /100 | #269 | Tragic $49,997 |
| Mexicans | 0.5 /100 | #270 | Tragic $49,989 |
| Taiwanese | 0.3 /100 | #271 | Tragic $49,804 |
| Colville | 0.3 /100 | #272 | Tragic $49,774 |
| Slovaks | 0.3 /100 | #273 | Tragic $49,753 |
| Immigrants | Senegal | 0.3 /100 | #274 | Tragic $49,742 |
| Immigrants | Kenya | 0.2 /100 | #275 | Tragic $49,633 |
| Dominicans | 0.2 /100 | #276 | Tragic $49,633 |
| Immigrants | Western Africa | 0.2 /100 | #277 | Tragic $49,621 |
| Nigerians | 0.1 /100 | #278 | Tragic $49,416 |
| Apache | 0.1 /100 | #279 | Tragic $49,395 |
| Hmong | 0.1 /100 | #280 | Tragic $49,364 |
| Immigrants | Nonimmigrants | 0.1 /100 | #281 | Tragic $49,348 |
Demographics Similar to U.S. Virgin Islanders by Householder Income Under 25 years
In terms of householder income under 25 years, the demographic groups most similar to U.S. Virgin Islanders are Iroquois ($47,380, a difference of 0.14%), Comanche ($47,518, a difference of 0.15%), Ottawa ($47,366, a difference of 0.17%), Bermudan ($47,359, a difference of 0.19%), and Bangladeshi ($47,589, a difference of 0.30%).
| Demographics | Rating | Rank | Householder Income Under 25 years |
| Immigrants | Liberia | 0.0 /100 | #302 | Tragic $47,981 |
| Immigrants | Middle Africa | 0.0 /100 | #303 | Tragic $47,916 |
| Menominee | 0.0 /100 | #304 | Tragic $47,907 |
| Cherokee | 0.0 /100 | #305 | Tragic $47,848 |
| Natives/Alaskans | 0.0 /100 | #306 | Tragic $47,704 |
| Bangladeshis | 0.0 /100 | #307 | Tragic $47,589 |
| Comanche | 0.0 /100 | #308 | Tragic $47,518 |
| U.S. Virgin Islanders | 0.0 /100 | #309 | Tragic $47,448 |
| Iroquois | 0.0 /100 | #310 | Tragic $47,380 |
| Ottawa | 0.0 /100 | #311 | Tragic $47,366 |
| Bermudans | 0.0 /100 | #312 | Tragic $47,359 |
| Delaware | 0.0 /100 | #313 | Tragic $47,159 |
| Chippewa | 0.0 /100 | #314 | Tragic $47,015 |
| Crow | 0.0 /100 | #315 | Tragic $47,012 |
| Sudanese | 0.0 /100 | #316 | Tragic $46,982 |