Immigrants from Brazil vs U.S. Virgin Islander Householder Income Under 25 years
COMPARE
Immigrants from Brazil
U.S. Virgin Islander
Householder Income Under 25 years
Householder Income Under 25 years Comparison
Immigrants from Brazil
U.S. Virgin Islanders
$54,487
HOUSEHOLDER INCOME UNDER 25 YEARS
99.6/ 100
METRIC RATING
76th/ 347
METRIC RANK
$47,448
HOUSEHOLDER INCOME UNDER 25 YEARS
0.0/ 100
METRIC RATING
309th/ 347
METRIC RANK
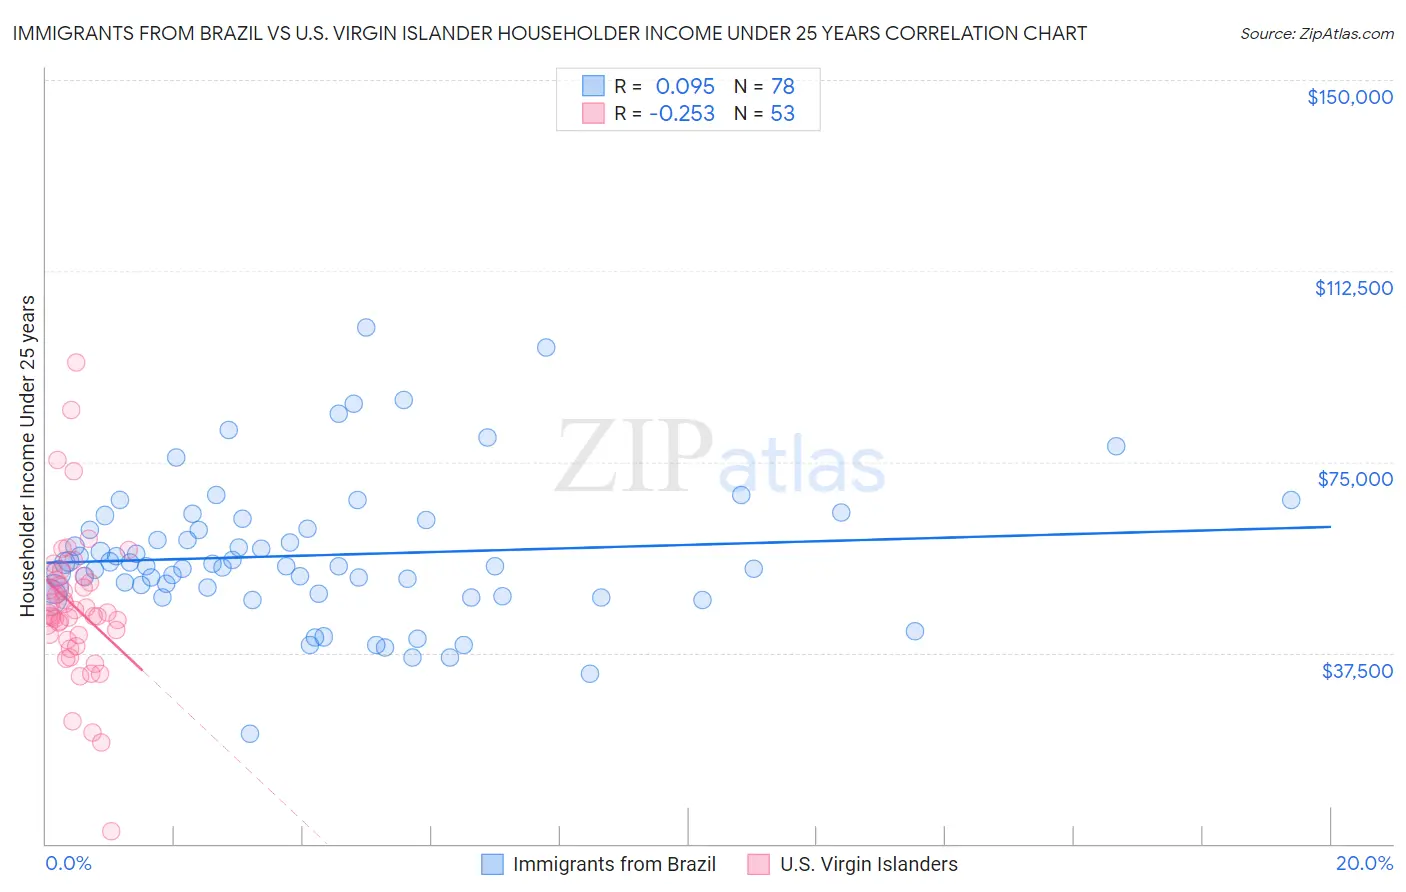
Immigrants from Brazil vs U.S. Virgin Islander Householder Income Under 25 years Correlation Chart
The statistical analysis conducted on geographies consisting of 290,809,322 people shows a slight positive correlation between the proportion of Immigrants from Brazil and household income with householder under the age of 25 in the United States with a correlation coefficient (R) of 0.095 and weighted average of $54,487. Similarly, the statistical analysis conducted on geographies consisting of 82,202,260 people shows a weak negative correlation between the proportion of U.S. Virgin Islanders and household income with householder under the age of 25 in the United States with a correlation coefficient (R) of -0.253 and weighted average of $47,448, a difference of 14.8%.
Householder Income Under 25 years Correlation Summary
| Measurement | Immigrants from Brazil | U.S. Virgin Islander |
| Minimum | $21,618 | $2,499 |
| Maximum | $101,440 | $94,615 |
| Range | $79,822 | $92,116 |
| Mean | $56,652 | $46,588 |
| Median | $54,576 | $45,199 |
| Interquartile 25% (IQ1) | $49,112 | $40,580 |
| Interquartile 75% (IQ3) | $61,875 | $52,169 |
| Interquartile Range (IQR) | $12,763 | $11,589 |
| Standard Deviation (Sample) | $13,948 | $14,716 |
| Standard Deviation (Population) | $13,859 | $14,577 |
Similar Demographics by Householder Income Under 25 years
Demographics Similar to Immigrants from Brazil by Householder Income Under 25 years
In terms of householder income under 25 years, the demographic groups most similar to Immigrants from Brazil are Immigrants from Southern Europe ($54,484, a difference of 0.010%), Nepalese ($54,472, a difference of 0.030%), Immigrants from Sri Lanka ($54,512, a difference of 0.050%), Immigrants from Italy ($54,449, a difference of 0.070%), and Egyptian ($54,444, a difference of 0.080%).
| Demographics | Rating | Rank | Householder Income Under 25 years |
| Samoans | 99.7 /100 | #69 | Exceptional $54,610 |
| Immigrants | El Salvador | 99.7 /100 | #70 | Exceptional $54,599 |
| Immigrants | Morocco | 99.7 /100 | #71 | Exceptional $54,593 |
| Immigrants | Northern Europe | 99.7 /100 | #72 | Exceptional $54,571 |
| Macedonians | 99.7 /100 | #73 | Exceptional $54,563 |
| Immigrants | Grenada | 99.7 /100 | #74 | Exceptional $54,538 |
| Immigrants | Sri Lanka | 99.7 /100 | #75 | Exceptional $54,512 |
| Immigrants | Brazil | 99.6 /100 | #76 | Exceptional $54,487 |
| Immigrants | Southern Europe | 99.6 /100 | #77 | Exceptional $54,484 |
| Nepalese | 99.6 /100 | #78 | Exceptional $54,472 |
| Immigrants | Italy | 99.6 /100 | #79 | Exceptional $54,449 |
| Egyptians | 99.6 /100 | #80 | Exceptional $54,444 |
| Portuguese | 99.6 /100 | #81 | Exceptional $54,436 |
| Russians | 99.5 /100 | #82 | Exceptional $54,389 |
| Laotians | 99.5 /100 | #83 | Exceptional $54,369 |
Demographics Similar to U.S. Virgin Islanders by Householder Income Under 25 years
In terms of householder income under 25 years, the demographic groups most similar to U.S. Virgin Islanders are Iroquois ($47,380, a difference of 0.14%), Comanche ($47,518, a difference of 0.15%), Ottawa ($47,366, a difference of 0.17%), Bermudan ($47,359, a difference of 0.19%), and Bangladeshi ($47,589, a difference of 0.30%).
| Demographics | Rating | Rank | Householder Income Under 25 years |
| Immigrants | Liberia | 0.0 /100 | #302 | Tragic $47,981 |
| Immigrants | Middle Africa | 0.0 /100 | #303 | Tragic $47,916 |
| Menominee | 0.0 /100 | #304 | Tragic $47,907 |
| Cherokee | 0.0 /100 | #305 | Tragic $47,848 |
| Natives/Alaskans | 0.0 /100 | #306 | Tragic $47,704 |
| Bangladeshis | 0.0 /100 | #307 | Tragic $47,589 |
| Comanche | 0.0 /100 | #308 | Tragic $47,518 |
| U.S. Virgin Islanders | 0.0 /100 | #309 | Tragic $47,448 |
| Iroquois | 0.0 /100 | #310 | Tragic $47,380 |
| Ottawa | 0.0 /100 | #311 | Tragic $47,366 |
| Bermudans | 0.0 /100 | #312 | Tragic $47,359 |
| Delaware | 0.0 /100 | #313 | Tragic $47,159 |
| Chippewa | 0.0 /100 | #314 | Tragic $47,015 |
| Crow | 0.0 /100 | #315 | Tragic $47,012 |
| Sudanese | 0.0 /100 | #316 | Tragic $46,982 |