American vs U.S. Virgin Islander Householder Income Under 25 years
COMPARE
American
U.S. Virgin Islander
Householder Income Under 25 years
Householder Income Under 25 years Comparison
Americans
U.S. Virgin Islanders
$48,860
HOUSEHOLDER INCOME UNDER 25 YEARS
0.0/ 100
METRIC RATING
290th/ 347
METRIC RANK
$47,448
HOUSEHOLDER INCOME UNDER 25 YEARS
0.0/ 100
METRIC RATING
309th/ 347
METRIC RANK
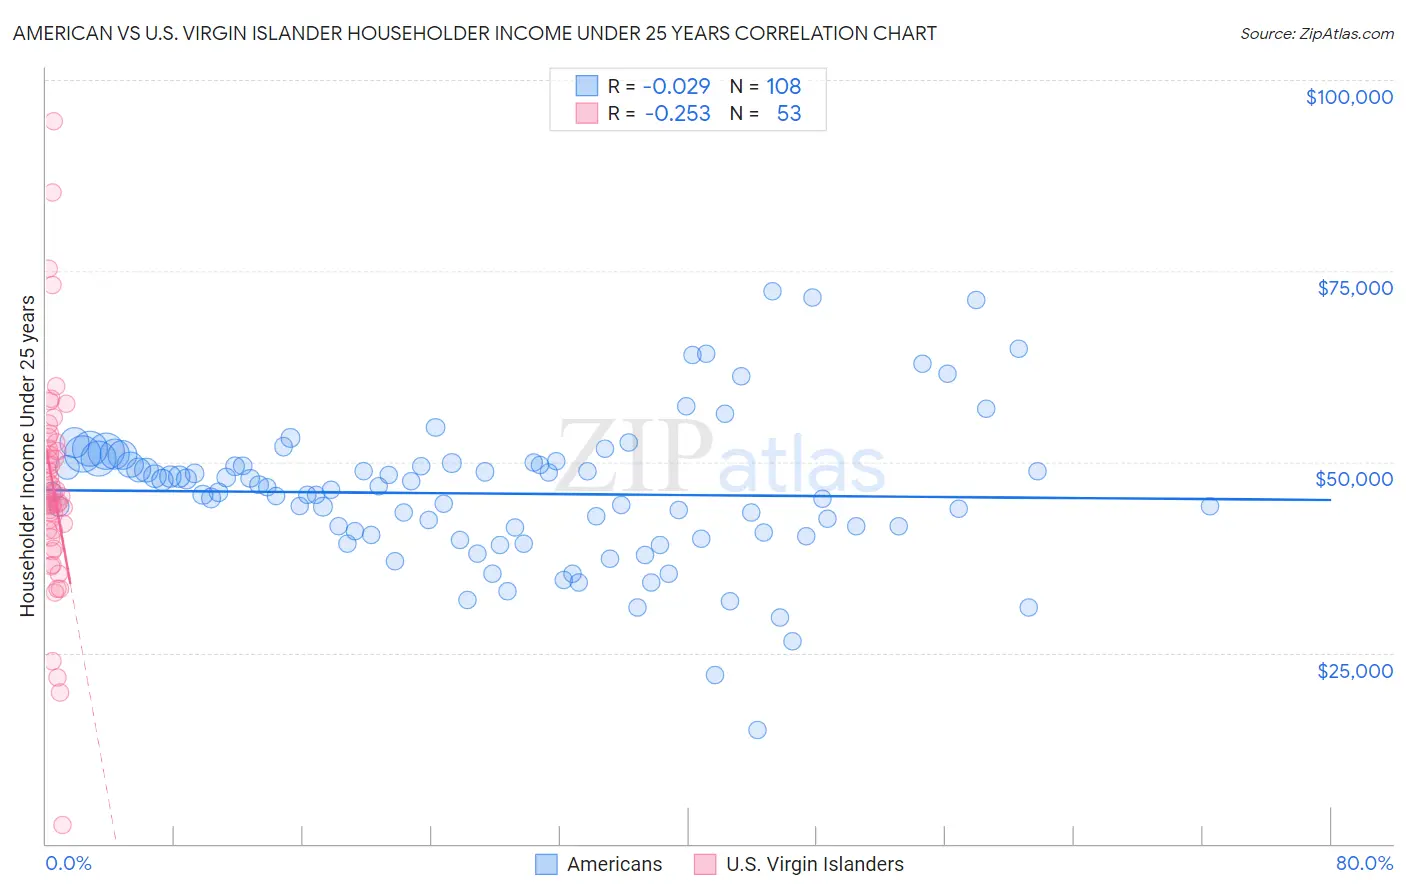
American vs U.S. Virgin Islander Householder Income Under 25 years Correlation Chart
The statistical analysis conducted on geographies consisting of 442,353,871 people shows no correlation between the proportion of Americans and household income with householder under the age of 25 in the United States with a correlation coefficient (R) of -0.029 and weighted average of $48,860. Similarly, the statistical analysis conducted on geographies consisting of 82,202,260 people shows a weak negative correlation between the proportion of U.S. Virgin Islanders and household income with householder under the age of 25 in the United States with a correlation coefficient (R) of -0.253 and weighted average of $47,448, a difference of 3.0%.
Householder Income Under 25 years Correlation Summary
| Measurement | American | U.S. Virgin Islander |
| Minimum | $14,959 | $2,499 |
| Maximum | $72,300 | $94,615 |
| Range | $57,341 | $92,116 |
| Mean | $45,842 | $46,588 |
| Median | $46,208 | $45,199 |
| Interquartile 25% (IQ1) | $40,591 | $40,580 |
| Interquartile 75% (IQ3) | $49,749 | $52,169 |
| Interquartile Range (IQR) | $9,157 | $11,589 |
| Standard Deviation (Sample) | $9,439 | $14,716 |
| Standard Deviation (Population) | $9,395 | $14,577 |
Demographics Similar to Americans and U.S. Virgin Islanders by Householder Income Under 25 years
In terms of householder income under 25 years, the demographic groups most similar to Americans are Honduran ($48,885, a difference of 0.050%), Immigrants from Burma/Myanmar ($48,749, a difference of 0.23%), Shoshone ($48,720, a difference of 0.29%), Subsaharan African ($48,691, a difference of 0.35%), and Somali ($48,657, a difference of 0.42%). Similarly, the demographic groups most similar to U.S. Virgin Islanders are Comanche ($47,518, a difference of 0.15%), Bangladeshi ($47,589, a difference of 0.30%), Native/Alaskan ($47,704, a difference of 0.54%), Cherokee ($47,848, a difference of 0.84%), and Menominee ($47,907, a difference of 0.97%).
| Demographics | Rating | Rank | Householder Income Under 25 years |
| Hondurans | 0.0 /100 | #289 | Tragic $48,885 |
| Americans | 0.0 /100 | #290 | Tragic $48,860 |
| Immigrants | Burma/Myanmar | 0.0 /100 | #291 | Tragic $48,749 |
| Shoshone | 0.0 /100 | #292 | Tragic $48,720 |
| Sub-Saharan Africans | 0.0 /100 | #293 | Tragic $48,691 |
| Somalis | 0.0 /100 | #294 | Tragic $48,657 |
| Central American Indians | 0.0 /100 | #295 | Tragic $48,643 |
| Blackfeet | 0.0 /100 | #296 | Tragic $48,603 |
| Cree | 0.0 /100 | #297 | Tragic $48,514 |
| Yaqui | 0.0 /100 | #298 | Tragic $48,300 |
| Immigrants | Honduras | 0.0 /100 | #299 | Tragic $48,267 |
| Immigrants | Somalia | 0.0 /100 | #300 | Tragic $48,135 |
| Immigrants | Kuwait | 0.0 /100 | #301 | Tragic $48,126 |
| Immigrants | Liberia | 0.0 /100 | #302 | Tragic $47,981 |
| Immigrants | Middle Africa | 0.0 /100 | #303 | Tragic $47,916 |
| Menominee | 0.0 /100 | #304 | Tragic $47,907 |
| Cherokee | 0.0 /100 | #305 | Tragic $47,848 |
| Natives/Alaskans | 0.0 /100 | #306 | Tragic $47,704 |
| Bangladeshis | 0.0 /100 | #307 | Tragic $47,589 |
| Comanche | 0.0 /100 | #308 | Tragic $47,518 |
| U.S. Virgin Islanders | 0.0 /100 | #309 | Tragic $47,448 |