Immigrants from Scotland vs Iranian Householder Income Ages 25 - 44 years
COMPARE
Immigrants from Scotland
Iranian
Householder Income Ages 25 - 44 years
Householder Income Ages 25 - 44 years Comparison
Immigrants from Scotland
Iranians
$105,089
HOUSEHOLDER INCOME AGES 25 - 44 YEARS
99.7/ 100
METRIC RATING
63rd/ 347
METRIC RANK
$120,292
HOUSEHOLDER INCOME AGES 25 - 44 YEARS
100.0/ 100
METRIC RATING
8th/ 347
METRIC RANK
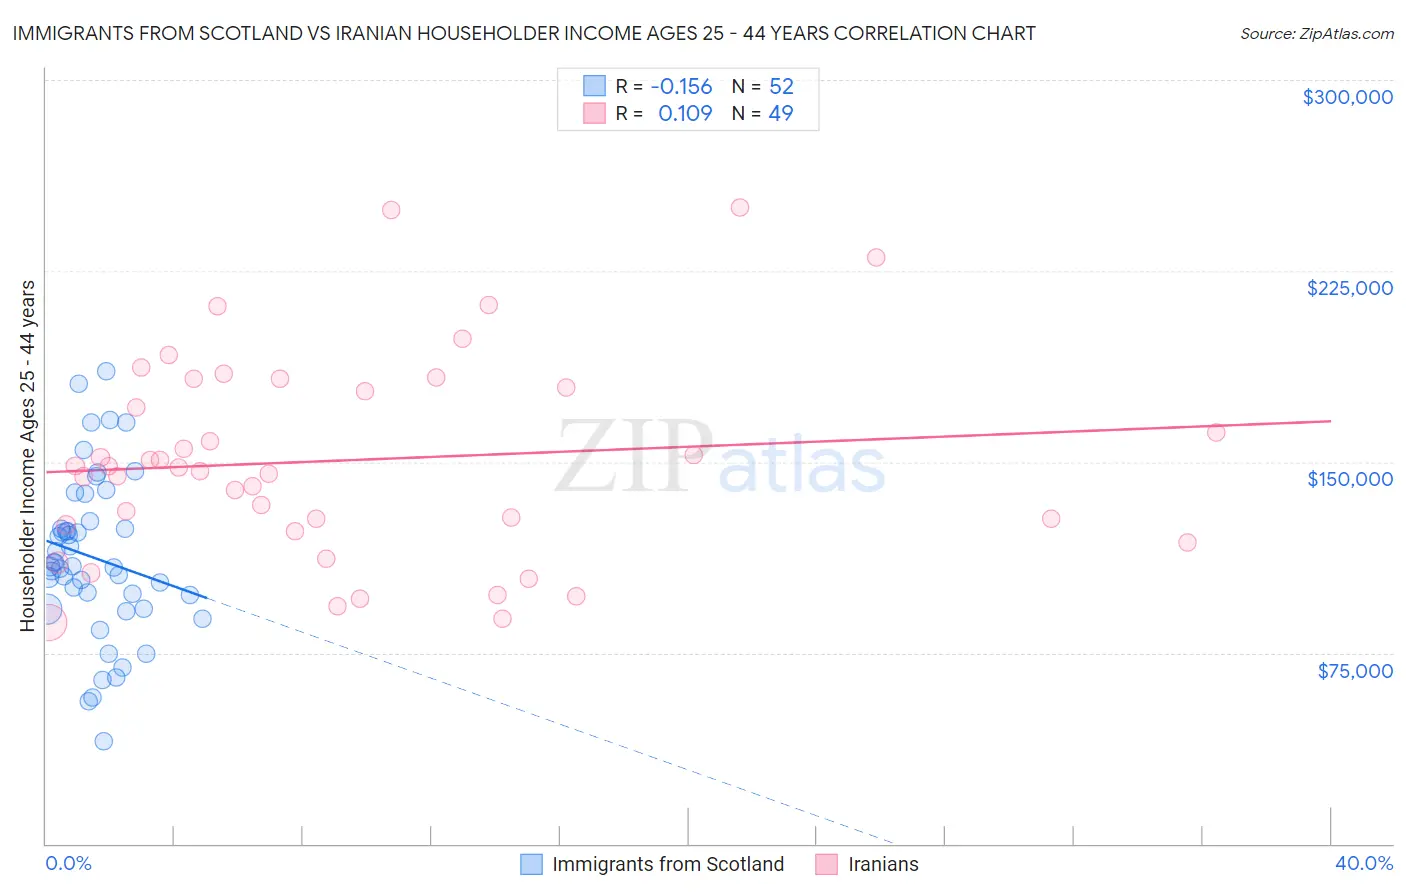
Immigrants from Scotland vs Iranian Householder Income Ages 25 - 44 years Correlation Chart
The statistical analysis conducted on geographies consisting of 196,028,874 people shows a poor negative correlation between the proportion of Immigrants from Scotland and household income with householder between the ages 25 and 44 in the United States with a correlation coefficient (R) of -0.156 and weighted average of $105,089. Similarly, the statistical analysis conducted on geographies consisting of 316,256,370 people shows a poor positive correlation between the proportion of Iranians and household income with householder between the ages 25 and 44 in the United States with a correlation coefficient (R) of 0.109 and weighted average of $120,292, a difference of 14.5%.
Householder Income Ages 25 - 44 years Correlation Summary
| Measurement | Immigrants from Scotland | Iranian |
| Minimum | $40,208 | $87,093 |
| Maximum | $185,630 | $250,001 |
| Range | $145,422 | $162,908 |
| Mean | $112,259 | $150,667 |
| Median | $108,926 | $147,708 |
| Interquartile 25% (IQ1) | $94,857 | $124,074 |
| Interquartile 75% (IQ3) | $125,232 | $181,001 |
| Interquartile Range (IQR) | $30,375 | $56,927 |
| Standard Deviation (Sample) | $31,667 | $40,122 |
| Standard Deviation (Population) | $31,361 | $39,710 |
Similar Demographics by Householder Income Ages 25 - 44 years
Demographics Similar to Immigrants from Scotland by Householder Income Ages 25 - 44 years
In terms of householder income ages 25 - 44 years, the demographic groups most similar to Immigrants from Scotland are New Zealander ($105,085, a difference of 0.0%), Immigrants from Netherlands ($105,082, a difference of 0.010%), Laotian ($104,993, a difference of 0.090%), Immigrants from Italy ($105,201, a difference of 0.11%), and Lithuanian ($105,223, a difference of 0.13%).
| Demographics | Rating | Rank | Householder Income Ages 25 - 44 years |
| Immigrants | Pakistan | 99.8 /100 | #56 | Exceptional $106,129 |
| Immigrants | Austria | 99.8 /100 | #57 | Exceptional $106,103 |
| Immigrants | South Africa | 99.8 /100 | #58 | Exceptional $105,748 |
| Immigrants | Latvia | 99.8 /100 | #59 | Exceptional $105,522 |
| Egyptians | 99.7 /100 | #60 | Exceptional $105,282 |
| Lithuanians | 99.7 /100 | #61 | Exceptional $105,223 |
| Immigrants | Italy | 99.7 /100 | #62 | Exceptional $105,201 |
| Immigrants | Scotland | 99.7 /100 | #63 | Exceptional $105,089 |
| New Zealanders | 99.7 /100 | #64 | Exceptional $105,085 |
| Immigrants | Netherlands | 99.7 /100 | #65 | Exceptional $105,082 |
| Laotians | 99.7 /100 | #66 | Exceptional $104,993 |
| Immigrants | Romania | 99.6 /100 | #67 | Exceptional $104,713 |
| Immigrants | Eastern Europe | 99.6 /100 | #68 | Exceptional $104,662 |
| Mongolians | 99.6 /100 | #69 | Exceptional $104,578 |
| Immigrants | Croatia | 99.6 /100 | #70 | Exceptional $104,503 |
Demographics Similar to Iranians by Householder Income Ages 25 - 44 years
In terms of householder income ages 25 - 44 years, the demographic groups most similar to Iranians are Immigrants from Ireland ($120,333, a difference of 0.030%), Immigrants from China ($119,756, a difference of 0.45%), Indian (Asian) ($119,496, a difference of 0.67%), Okinawan ($119,349, a difference of 0.79%), and Immigrants from Iran ($119,204, a difference of 0.91%).
| Demographics | Rating | Rank | Householder Income Ages 25 - 44 years |
| Immigrants | Taiwan | 100.0 /100 | #1 | Exceptional $129,122 |
| Filipinos | 100.0 /100 | #2 | Exceptional $128,723 |
| Immigrants | Hong Kong | 100.0 /100 | #3 | Exceptional $128,140 |
| Immigrants | Singapore | 100.0 /100 | #4 | Exceptional $124,429 |
| Immigrants | India | 100.0 /100 | #5 | Exceptional $124,238 |
| Thais | 100.0 /100 | #6 | Exceptional $121,778 |
| Immigrants | Ireland | 100.0 /100 | #7 | Exceptional $120,333 |
| Iranians | 100.0 /100 | #8 | Exceptional $120,292 |
| Immigrants | China | 100.0 /100 | #9 | Exceptional $119,756 |
| Indians (Asian) | 100.0 /100 | #10 | Exceptional $119,496 |
| Okinawans | 100.0 /100 | #11 | Exceptional $119,349 |
| Immigrants | Iran | 100.0 /100 | #12 | Exceptional $119,204 |
| Immigrants | Eastern Asia | 100.0 /100 | #13 | Exceptional $118,056 |
| Immigrants | Israel | 100.0 /100 | #14 | Exceptional $117,219 |
| Immigrants | South Central Asia | 100.0 /100 | #15 | Exceptional $116,626 |