Hopi vs Iranian Householder Income Ages 25 - 44 years
COMPARE
Hopi
Iranian
Householder Income Ages 25 - 44 years
Householder Income Ages 25 - 44 years Comparison
Hopi
Iranians
$75,002
HOUSEHOLDER INCOME AGES 25 - 44 YEARS
0.0/ 100
METRIC RATING
333rd/ 347
METRIC RANK
$120,292
HOUSEHOLDER INCOME AGES 25 - 44 YEARS
100.0/ 100
METRIC RATING
8th/ 347
METRIC RANK
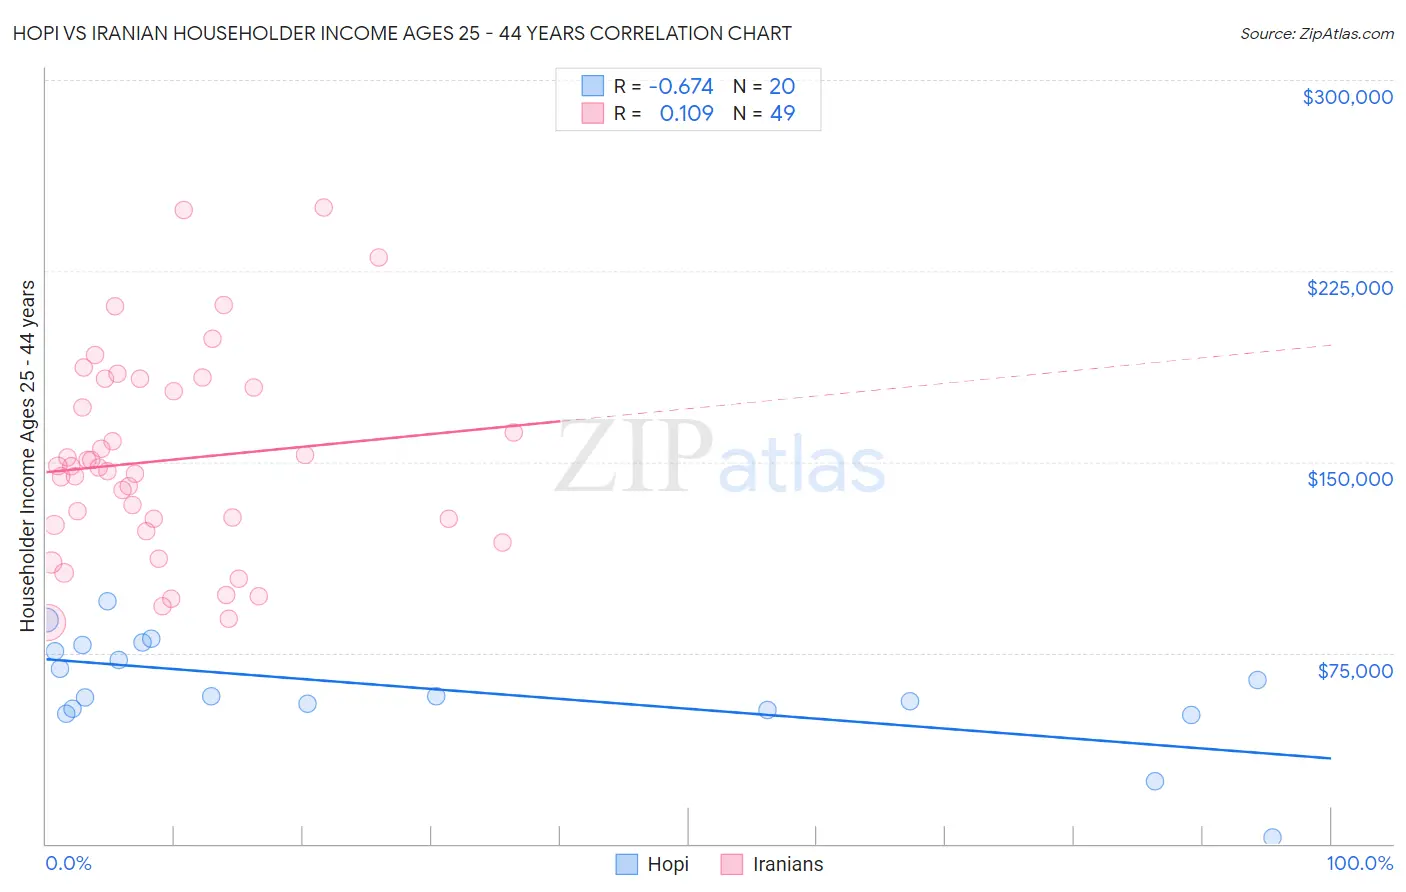
Hopi vs Iranian Householder Income Ages 25 - 44 years Correlation Chart
The statistical analysis conducted on geographies consisting of 74,668,880 people shows a significant negative correlation between the proportion of Hopi and household income with householder between the ages 25 and 44 in the United States with a correlation coefficient (R) of -0.674 and weighted average of $75,002. Similarly, the statistical analysis conducted on geographies consisting of 316,256,370 people shows a poor positive correlation between the proportion of Iranians and household income with householder between the ages 25 and 44 in the United States with a correlation coefficient (R) of 0.109 and weighted average of $120,292, a difference of 60.4%.
Householder Income Ages 25 - 44 years Correlation Summary
| Measurement | Hopi | Iranian |
| Minimum | $2,499 | $87,093 |
| Maximum | $95,278 | $250,001 |
| Range | $92,779 | $162,908 |
| Mean | $61,016 | $150,667 |
| Median | $57,812 | $147,708 |
| Interquartile 25% (IQ1) | $52,840 | $124,074 |
| Interquartile 75% (IQ3) | $76,984 | $181,001 |
| Interquartile Range (IQR) | $24,144 | $56,927 |
| Standard Deviation (Sample) | $21,159 | $40,122 |
| Standard Deviation (Population) | $20,623 | $39,710 |
Similar Demographics by Householder Income Ages 25 - 44 years
Demographics Similar to Hopi by Householder Income Ages 25 - 44 years
In terms of householder income ages 25 - 44 years, the demographic groups most similar to Hopi are Creek ($74,847, a difference of 0.21%), Kiowa ($74,776, a difference of 0.30%), Bahamian ($75,395, a difference of 0.52%), Native/Alaskan ($75,647, a difference of 0.86%), and Yakama ($76,226, a difference of 1.6%).
| Demographics | Rating | Rank | Householder Income Ages 25 - 44 years |
| Houma | 0.0 /100 | #326 | Tragic $77,044 |
| Immigrants | Bahamas | 0.0 /100 | #327 | Tragic $76,910 |
| Immigrants | Cuba | 0.0 /100 | #328 | Tragic $76,701 |
| Seminole | 0.0 /100 | #329 | Tragic $76,584 |
| Yakama | 0.0 /100 | #330 | Tragic $76,226 |
| Natives/Alaskans | 0.0 /100 | #331 | Tragic $75,647 |
| Bahamians | 0.0 /100 | #332 | Tragic $75,395 |
| Hopi | 0.0 /100 | #333 | Tragic $75,002 |
| Creek | 0.0 /100 | #334 | Tragic $74,847 |
| Kiowa | 0.0 /100 | #335 | Tragic $74,776 |
| Yup'ik | 0.0 /100 | #336 | Tragic $73,688 |
| Blacks/African Americans | 0.0 /100 | #337 | Tragic $73,370 |
| Immigrants | Yemen | 0.0 /100 | #338 | Tragic $73,043 |
| Yuman | 0.0 /100 | #339 | Tragic $72,956 |
| Immigrants | Congo | 0.0 /100 | #340 | Tragic $72,178 |
Demographics Similar to Iranians by Householder Income Ages 25 - 44 years
In terms of householder income ages 25 - 44 years, the demographic groups most similar to Iranians are Immigrants from Ireland ($120,333, a difference of 0.030%), Immigrants from China ($119,756, a difference of 0.45%), Indian (Asian) ($119,496, a difference of 0.67%), Okinawan ($119,349, a difference of 0.79%), and Immigrants from Iran ($119,204, a difference of 0.91%).
| Demographics | Rating | Rank | Householder Income Ages 25 - 44 years |
| Immigrants | Taiwan | 100.0 /100 | #1 | Exceptional $129,122 |
| Filipinos | 100.0 /100 | #2 | Exceptional $128,723 |
| Immigrants | Hong Kong | 100.0 /100 | #3 | Exceptional $128,140 |
| Immigrants | Singapore | 100.0 /100 | #4 | Exceptional $124,429 |
| Immigrants | India | 100.0 /100 | #5 | Exceptional $124,238 |
| Thais | 100.0 /100 | #6 | Exceptional $121,778 |
| Immigrants | Ireland | 100.0 /100 | #7 | Exceptional $120,333 |
| Iranians | 100.0 /100 | #8 | Exceptional $120,292 |
| Immigrants | China | 100.0 /100 | #9 | Exceptional $119,756 |
| Indians (Asian) | 100.0 /100 | #10 | Exceptional $119,496 |
| Okinawans | 100.0 /100 | #11 | Exceptional $119,349 |
| Immigrants | Iran | 100.0 /100 | #12 | Exceptional $119,204 |
| Immigrants | Eastern Asia | 100.0 /100 | #13 | Exceptional $118,056 |
| Immigrants | Israel | 100.0 /100 | #14 | Exceptional $117,219 |
| Immigrants | South Central Asia | 100.0 /100 | #15 | Exceptional $116,626 |