Immigrants from Saudi Arabia vs Immigrants from North Macedonia Median Female Earnings
COMPARE
Immigrants from Saudi Arabia
Immigrants from North Macedonia
Median Female Earnings
Median Female Earnings Comparison
Immigrants from Saudi Arabia
Immigrants from North Macedonia
$39,952
MEDIAN FEMALE EARNINGS
62.9/ 100
METRIC RATING
164th/ 347
METRIC RANK
$40,488
MEDIAN FEMALE EARNINGS
83.8/ 100
METRIC RATING
144th/ 347
METRIC RANK
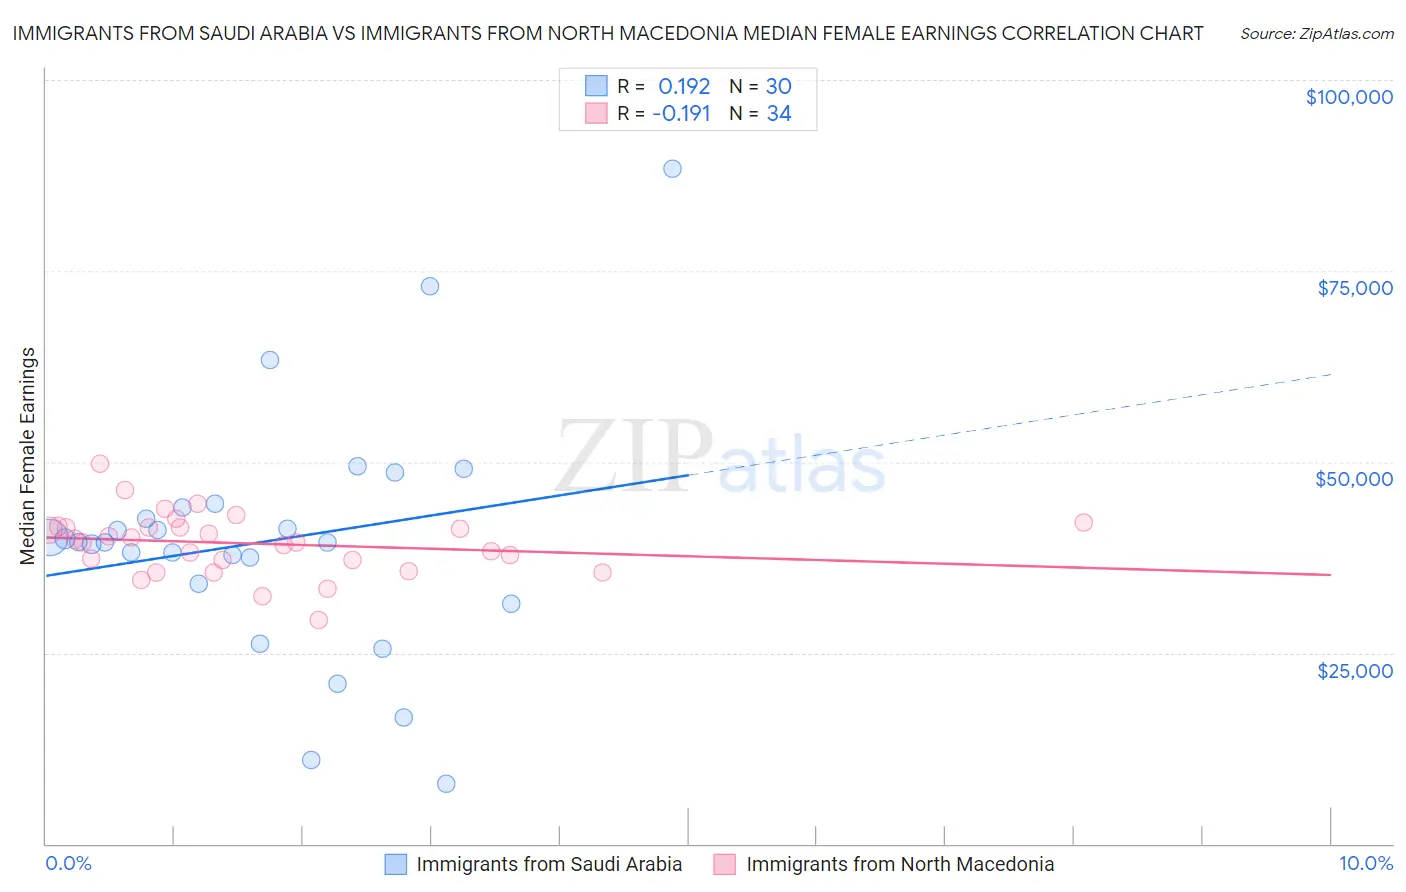
Immigrants from Saudi Arabia vs Immigrants from North Macedonia Median Female Earnings Correlation Chart
The statistical analysis conducted on geographies consisting of 164,288,705 people shows a poor positive correlation between the proportion of Immigrants from Saudi Arabia and median female earnings in the United States with a correlation coefficient (R) of 0.192 and weighted average of $39,952. Similarly, the statistical analysis conducted on geographies consisting of 74,042,106 people shows a poor negative correlation between the proportion of Immigrants from North Macedonia and median female earnings in the United States with a correlation coefficient (R) of -0.191 and weighted average of $40,488, a difference of 1.3%.
Median Female Earnings Correlation Summary
| Measurement | Immigrants from Saudi Arabia | Immigrants from North Macedonia |
| Minimum | $7,776 | $29,254 |
| Maximum | $88,365 | $49,827 |
| Range | $80,589 | $20,573 |
| Mean | $39,642 | $39,315 |
| Median | $39,517 | $39,666 |
| Interquartile 25% (IQ1) | $34,071 | $37,214 |
| Interquartile 75% (IQ3) | $44,081 | $41,437 |
| Interquartile Range (IQR) | $10,011 | $4,223 |
| Standard Deviation (Sample) | $16,173 | $4,067 |
| Standard Deviation (Population) | $15,901 | $4,007 |
Demographics Similar to Immigrants from Saudi Arabia and Immigrants from North Macedonia by Median Female Earnings
In terms of median female earnings, the demographic groups most similar to Immigrants from Saudi Arabia are Lebanese ($40,006, a difference of 0.14%), South American Indian ($40,019, a difference of 0.17%), Alsatian ($40,060, a difference of 0.27%), Inupiat ($40,080, a difference of 0.32%), and Immigrants from Vietnam ($40,153, a difference of 0.50%). Similarly, the demographic groups most similar to Immigrants from North Macedonia are Brazilian ($40,483, a difference of 0.010%), Ghanaian ($40,429, a difference of 0.15%), Vietnamese ($40,377, a difference of 0.27%), Polish ($40,371, a difference of 0.29%), and Immigrants from Cameroon ($40,354, a difference of 0.33%).
| Demographics | Rating | Rank | Median Female Earnings |
| Immigrants | North Macedonia | 83.8 /100 | #144 | Excellent $40,488 |
| Brazilians | 83.6 /100 | #145 | Excellent $40,483 |
| Ghanaians | 82.1 /100 | #146 | Excellent $40,429 |
| Vietnamese | 80.4 /100 | #147 | Excellent $40,377 |
| Poles | 80.2 /100 | #148 | Excellent $40,371 |
| Immigrants | Cameroon | 79.7 /100 | #149 | Good $40,354 |
| Immigrants | Chile | 79.6 /100 | #150 | Good $40,353 |
| Immigrants | Armenia | 79.2 /100 | #151 | Good $40,340 |
| West Indians | 78.4 /100 | #152 | Good $40,317 |
| British West Indians | 77.7 /100 | #153 | Good $40,299 |
| Immigrants | Oceania | 77.6 /100 | #154 | Good $40,297 |
| Immigrants | Africa | 76.2 /100 | #155 | Good $40,257 |
| Peruvians | 75.3 /100 | #156 | Good $40,234 |
| Portuguese | 73.0 /100 | #157 | Good $40,177 |
| Immigrants | Senegal | 72.2 /100 | #158 | Good $40,157 |
| Immigrants | Vietnam | 72.0 /100 | #159 | Good $40,153 |
| Inupiat | 68.9 /100 | #160 | Good $40,080 |
| Alsatians | 68.0 /100 | #161 | Good $40,060 |
| South American Indians | 66.1 /100 | #162 | Good $40,019 |
| Lebanese | 65.5 /100 | #163 | Good $40,006 |
| Immigrants | Saudi Arabia | 62.9 /100 | #164 | Good $39,952 |