Immigrants from Russia vs Yaqui Unemployment Among Ages 16 to 19 years
COMPARE
Immigrants from Russia
Yaqui
Unemployment Among Ages 16 to 19 years
Unemployment Among Ages 16 to 19 years Comparison
Immigrants from Russia
Yaqui
18.2%
UNEMPLOYMENT AMONG AGES 16 TO 19 YEARS
4.0/ 100
METRIC RATING
232nd/ 347
METRIC RANK
19.0%
UNEMPLOYMENT AMONG AGES 16 TO 19 YEARS
0.1/ 100
METRIC RATING
264th/ 347
METRIC RANK
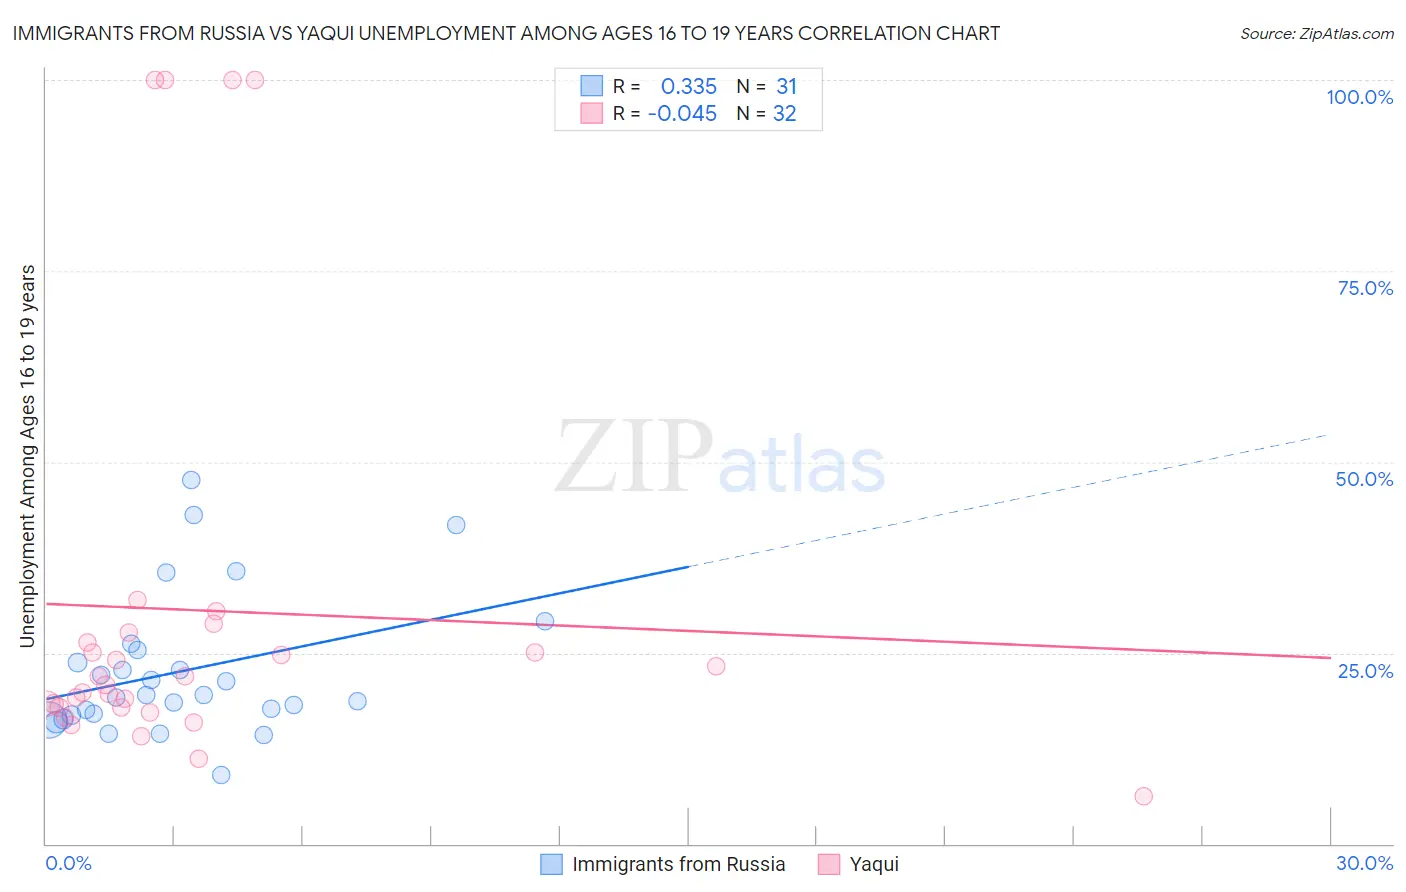
Immigrants from Russia vs Yaqui Unemployment Among Ages 16 to 19 years Correlation Chart
The statistical analysis conducted on geographies consisting of 331,872,776 people shows a mild positive correlation between the proportion of Immigrants from Russia and unemployment rate among population between the ages 16 and 19 in the United States with a correlation coefficient (R) of 0.335 and weighted average of 18.2%. Similarly, the statistical analysis conducted on geographies consisting of 105,605,513 people shows no correlation between the proportion of Yaqui and unemployment rate among population between the ages 16 and 19 in the United States with a correlation coefficient (R) of -0.045 and weighted average of 19.0%, a difference of 4.0%.
Unemployment Among Ages 16 to 19 years Correlation Summary
| Measurement | Immigrants from Russia | Yaqui |
| Minimum | 8.9% | 6.3% |
| Maximum | 47.5% | 100.0% |
| Range | 38.6% | 93.7% |
| Mean | 22.6% | 30.6% |
| Median | 19.4% | 21.3% |
| Interquartile 25% (IQ1) | 16.9% | 17.9% |
| Interquartile 75% (IQ3) | 25.3% | 27.0% |
| Interquartile Range (IQR) | 8.4% | 9.1% |
| Standard Deviation (Sample) | 9.2% | 27.2% |
| Standard Deviation (Population) | 9.0% | 26.8% |
Similar Demographics by Unemployment Among Ages 16 to 19 years
Demographics Similar to Immigrants from Russia by Unemployment Among Ages 16 to 19 years
In terms of unemployment among ages 16 to 19 years, the demographic groups most similar to Immigrants from Russia are Seminole (18.2%, a difference of 0.0%), Nepalese (18.2%, a difference of 0.050%), Colombian (18.3%, a difference of 0.11%), Spanish American (18.2%, a difference of 0.18%), and French American Indian (18.3%, a difference of 0.40%).
| Demographics | Rating | Rank | Unemployment Among Ages 16 to 19 years |
| Immigrants | Chile | 7.5 /100 | #225 | Tragic 18.1% |
| Immigrants | Belgium | 7.3 /100 | #226 | Tragic 18.1% |
| Immigrants | Liberia | 7.1 /100 | #227 | Tragic 18.1% |
| Immigrants | Greece | 7.1 /100 | #228 | Tragic 18.1% |
| Albanians | 5.8 /100 | #229 | Tragic 18.2% |
| Spanish Americans | 4.7 /100 | #230 | Tragic 18.2% |
| Nepalese | 4.2 /100 | #231 | Tragic 18.2% |
| Immigrants | Russia | 4.0 /100 | #232 | Tragic 18.2% |
| Seminole | 4.0 /100 | #233 | Tragic 18.2% |
| Colombians | 3.7 /100 | #234 | Tragic 18.3% |
| French American Indians | 2.9 /100 | #235 | Tragic 18.3% |
| Immigrants | Colombia | 2.7 /100 | #236 | Tragic 18.3% |
| Immigrants | Immigrants | 2.7 /100 | #237 | Tragic 18.3% |
| South Americans | 2.6 /100 | #238 | Tragic 18.3% |
| Native Hawaiians | 2.4 /100 | #239 | Tragic 18.3% |
Demographics Similar to Yaqui by Unemployment Among Ages 16 to 19 years
In terms of unemployment among ages 16 to 19 years, the demographic groups most similar to Yaqui are Choctaw (19.0%, a difference of 0.010%), Cree (19.0%, a difference of 0.030%), Immigrants from Honduras (19.0%, a difference of 0.10%), Salvadoran (18.9%, a difference of 0.16%), and Spanish American Indian (18.9%, a difference of 0.20%).
| Demographics | Rating | Rank | Unemployment Among Ages 16 to 19 years |
| Immigrants | Nigeria | 0.2 /100 | #257 | Tragic 18.9% |
| Immigrants | Mexico | 0.2 /100 | #258 | Tragic 18.9% |
| Immigrants | Central America | 0.2 /100 | #259 | Tragic 18.9% |
| Nigerians | 0.2 /100 | #260 | Tragic 18.9% |
| Spanish American Indians | 0.1 /100 | #261 | Tragic 18.9% |
| Salvadorans | 0.1 /100 | #262 | Tragic 18.9% |
| Cree | 0.1 /100 | #263 | Tragic 19.0% |
| Yaqui | 0.1 /100 | #264 | Tragic 19.0% |
| Choctaw | 0.1 /100 | #265 | Tragic 19.0% |
| Immigrants | Honduras | 0.1 /100 | #266 | Tragic 19.0% |
| Israelis | 0.1 /100 | #267 | Tragic 19.0% |
| Immigrants | El Salvador | 0.1 /100 | #268 | Tragic 19.1% |
| Lumbee | 0.1 /100 | #269 | Tragic 19.1% |
| Hondurans | 0.1 /100 | #270 | Tragic 19.2% |
| Blackfeet | 0.0 /100 | #271 | Tragic 19.2% |