Immigrants from Israel vs Lithuanian Householder Income Ages 45 - 64 years
COMPARE
Immigrants from Israel
Lithuanian
Householder Income Ages 45 - 64 years
Householder Income Ages 45 - 64 years Comparison
Immigrants from Israel
Lithuanians
$122,893
HOUSEHOLDER INCOME AGES 45 - 64 YEARS
100.0/ 100
METRIC RATING
12th/ 347
METRIC RANK
$112,484
HOUSEHOLDER INCOME AGES 45 - 64 YEARS
99.8/ 100
METRIC RATING
55th/ 347
METRIC RANK
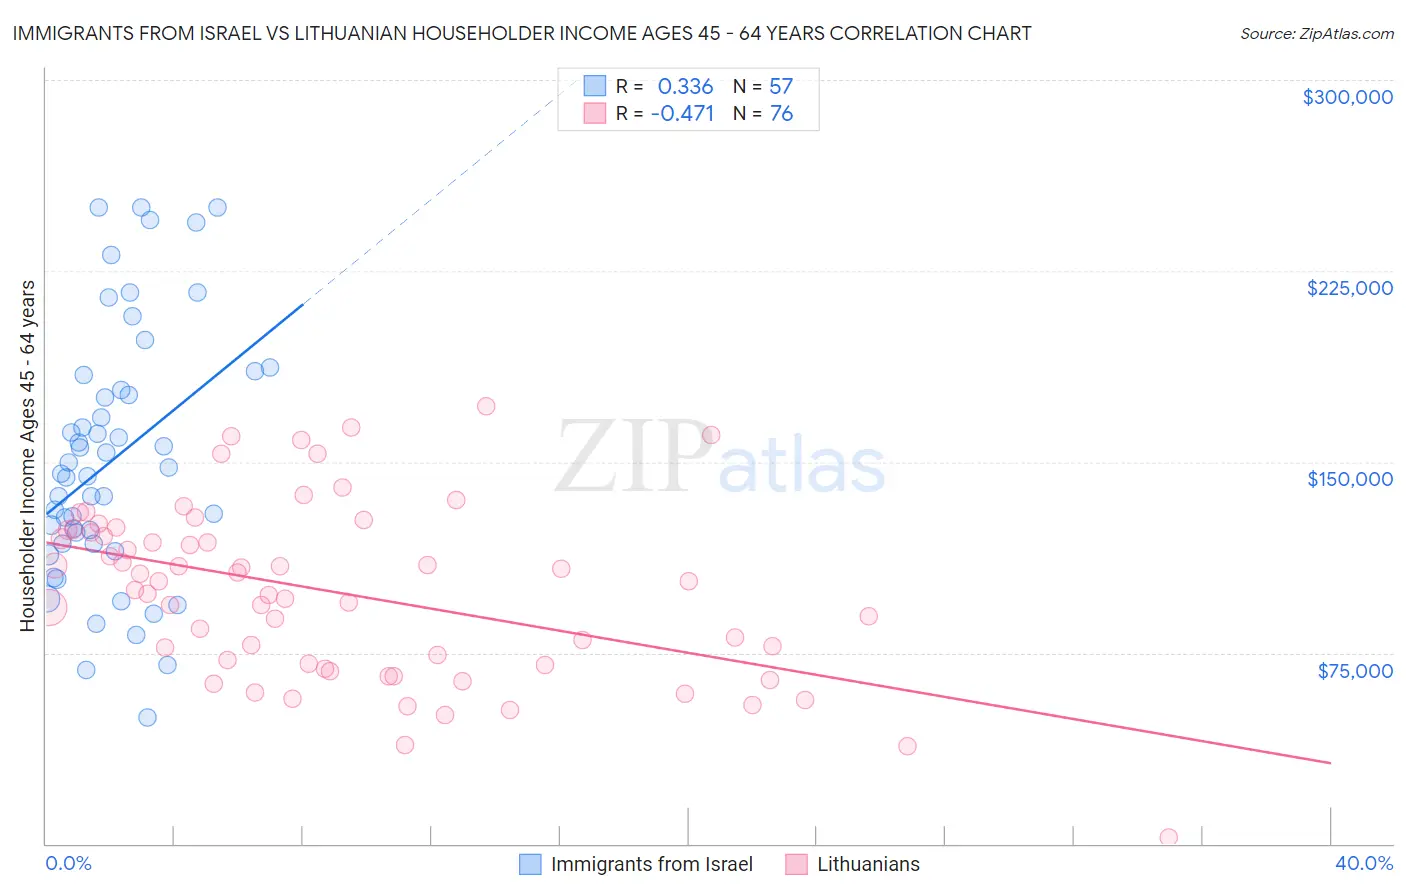
Immigrants from Israel vs Lithuanian Householder Income Ages 45 - 64 years Correlation Chart
The statistical analysis conducted on geographies consisting of 209,875,627 people shows a mild positive correlation between the proportion of Immigrants from Israel and household income with householder between the ages 45 and 64 in the United States with a correlation coefficient (R) of 0.336 and weighted average of $122,893. Similarly, the statistical analysis conducted on geographies consisting of 421,155,737 people shows a moderate negative correlation between the proportion of Lithuanians and household income with householder between the ages 45 and 64 in the United States with a correlation coefficient (R) of -0.471 and weighted average of $112,484, a difference of 9.2%.
Householder Income Ages 45 - 64 years Correlation Summary
| Measurement | Immigrants from Israel | Lithuanian |
| Minimum | $49,413 | $2,499 |
| Maximum | $250,001 | $171,736 |
| Range | $200,588 | $169,237 |
| Mean | $150,945 | $98,659 |
| Median | $145,254 | $101,418 |
| Interquartile 25% (IQ1) | $117,950 | $70,474 |
| Interquartile 75% (IQ3) | $181,200 | $122,894 |
| Interquartile Range (IQR) | $63,250 | $52,420 |
| Standard Deviation (Sample) | $49,727 | $34,121 |
| Standard Deviation (Population) | $49,289 | $33,896 |
Similar Demographics by Householder Income Ages 45 - 64 years
Demographics Similar to Immigrants from Israel by Householder Income Ages 45 - 64 years
In terms of householder income ages 45 - 64 years, the demographic groups most similar to Immigrants from Israel are Immigrants from Ireland ($122,757, a difference of 0.11%), Cypriot ($123,396, a difference of 0.41%), Indian (Asian) ($122,343, a difference of 0.45%), Immigrants from Eastern Asia ($122,222, a difference of 0.55%), and Immigrants from China ($122,178, a difference of 0.59%).
| Demographics | Rating | Rank | Householder Income Ages 45 - 64 years |
| Immigrants | Singapore | 100.0 /100 | #5 | Exceptional $129,514 |
| Iranians | 100.0 /100 | #6 | Exceptional $129,350 |
| Immigrants | Hong Kong | 100.0 /100 | #7 | Exceptional $127,500 |
| Immigrants | Iran | 100.0 /100 | #8 | Exceptional $126,940 |
| Okinawans | 100.0 /100 | #9 | Exceptional $124,796 |
| Immigrants | South Central Asia | 100.0 /100 | #10 | Exceptional $124,188 |
| Cypriots | 100.0 /100 | #11 | Exceptional $123,396 |
| Immigrants | Israel | 100.0 /100 | #12 | Exceptional $122,893 |
| Immigrants | Ireland | 100.0 /100 | #13 | Exceptional $122,757 |
| Indians (Asian) | 100.0 /100 | #14 | Exceptional $122,343 |
| Immigrants | Eastern Asia | 100.0 /100 | #15 | Exceptional $122,222 |
| Immigrants | China | 100.0 /100 | #16 | Exceptional $122,178 |
| Burmese | 100.0 /100 | #17 | Exceptional $121,444 |
| Immigrants | Korea | 100.0 /100 | #18 | Exceptional $121,243 |
| Eastern Europeans | 100.0 /100 | #19 | Exceptional $120,684 |
Demographics Similar to Lithuanians by Householder Income Ages 45 - 64 years
In terms of householder income ages 45 - 64 years, the demographic groups most similar to Lithuanians are Greek ($112,630, a difference of 0.13%), Afghan ($112,676, a difference of 0.17%), Egyptian ($112,256, a difference of 0.20%), Immigrants from Malaysia ($112,796, a difference of 0.28%), and Immigrants from Scotland ($112,175, a difference of 0.28%).
| Demographics | Rating | Rank | Householder Income Ages 45 - 64 years |
| Immigrants | Indonesia | 99.9 /100 | #48 | Exceptional $113,519 |
| Immigrants | Russia | 99.8 /100 | #49 | Exceptional $113,215 |
| Immigrants | Austria | 99.8 /100 | #50 | Exceptional $113,140 |
| Immigrants | South Africa | 99.8 /100 | #51 | Exceptional $112,886 |
| Immigrants | Malaysia | 99.8 /100 | #52 | Exceptional $112,796 |
| Afghans | 99.8 /100 | #53 | Exceptional $112,676 |
| Greeks | 99.8 /100 | #54 | Exceptional $112,630 |
| Lithuanians | 99.8 /100 | #55 | Exceptional $112,484 |
| Egyptians | 99.7 /100 | #56 | Exceptional $112,256 |
| Immigrants | Scotland | 99.7 /100 | #57 | Exceptional $112,175 |
| Soviet Union | 99.7 /100 | #58 | Exceptional $112,008 |
| Immigrants | Europe | 99.7 /100 | #59 | Exceptional $111,984 |
| Immigrants | Netherlands | 99.7 /100 | #60 | Exceptional $111,982 |
| Immigrants | Czechoslovakia | 99.7 /100 | #61 | Exceptional $111,914 |
| Immigrants | Norway | 99.7 /100 | #62 | Exceptional $111,669 |