Immigrants from Chile vs Venezuelan Median Household Income
COMPARE
Immigrants from Chile
Venezuelan
Median Household Income
Median Household Income Comparison
Immigrants from Chile
Venezuelans
$88,388
MEDIAN HOUSEHOLD INCOME
89.2/ 100
METRIC RATING
139th/ 347
METRIC RANK
$82,432
MEDIAN HOUSEHOLD INCOME
15.3/ 100
METRIC RATING
212th/ 347
METRIC RANK
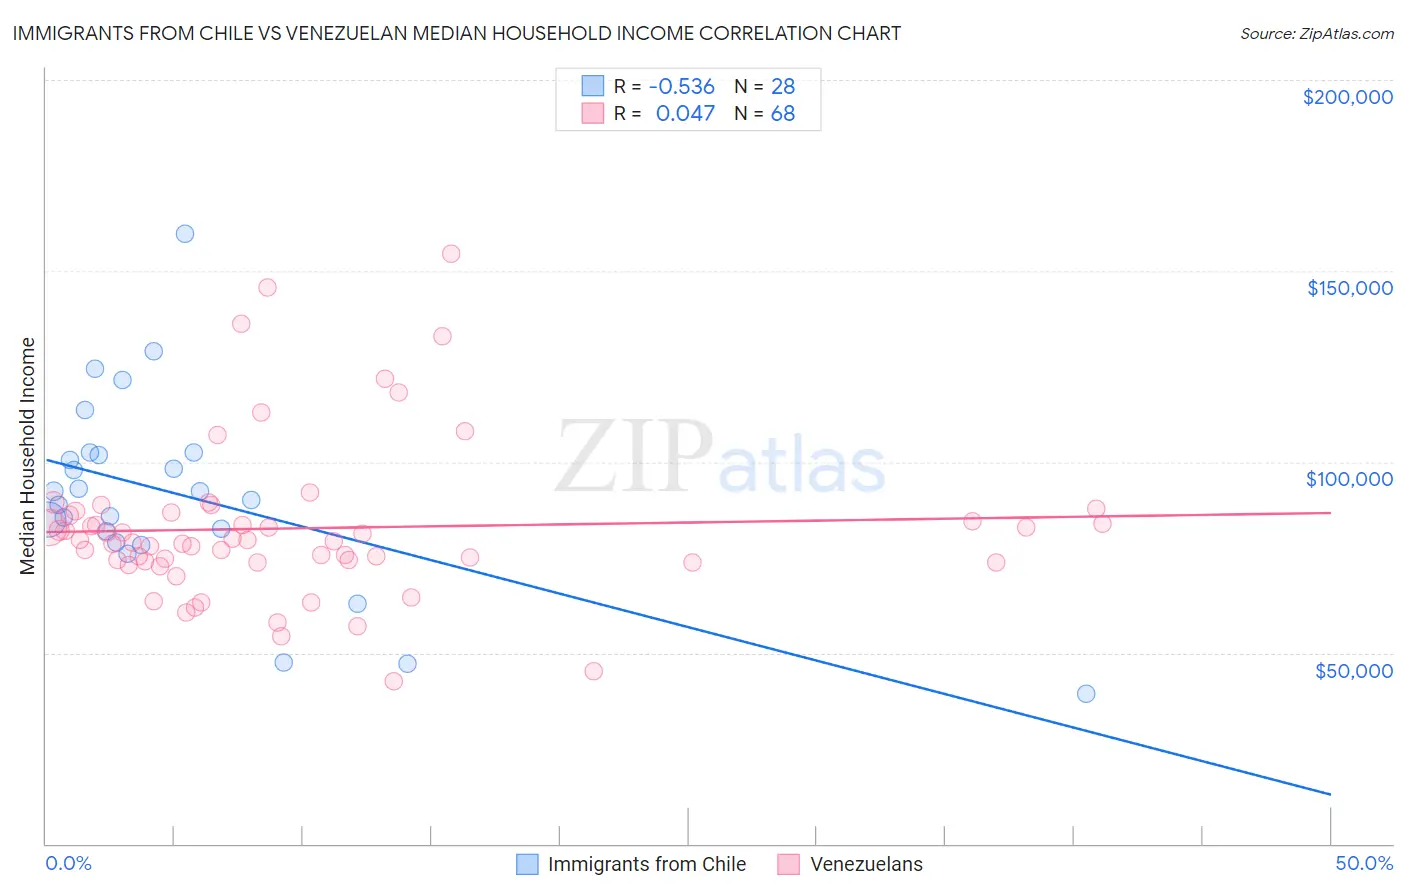
Immigrants from Chile vs Venezuelan Median Household Income Correlation Chart
The statistical analysis conducted on geographies consisting of 218,579,752 people shows a substantial negative correlation between the proportion of Immigrants from Chile and median household income in the United States with a correlation coefficient (R) of -0.536 and weighted average of $88,388. Similarly, the statistical analysis conducted on geographies consisting of 306,067,078 people shows no correlation between the proportion of Venezuelans and median household income in the United States with a correlation coefficient (R) of 0.047 and weighted average of $82,432, a difference of 7.2%.
Median Household Income Correlation Summary
| Measurement | Immigrants from Chile | Venezuelan |
| Minimum | $39,375 | $42,664 |
| Maximum | $159,688 | $154,652 |
| Range | $120,313 | $111,988 |
| Mean | $91,361 | $82,593 |
| Median | $91,251 | $79,442 |
| Interquartile 25% (IQ1) | $80,247 | $73,873 |
| Interquartile 75% (IQ3) | $102,116 | $86,330 |
| Interquartile Range (IQR) | $21,868 | $12,458 |
| Standard Deviation (Sample) | $25,347 | $20,652 |
| Standard Deviation (Population) | $24,890 | $20,500 |
Similar Demographics by Median Household Income
Demographics Similar to Immigrants from Chile by Median Household Income
In terms of median household income, the demographic groups most similar to Immigrants from Chile are Arab ($88,398, a difference of 0.010%), Sierra Leonean ($88,463, a difference of 0.080%), Polish ($88,472, a difference of 0.090%), Immigrants from Sierra Leone ($88,498, a difference of 0.12%), and Swedish ($88,524, a difference of 0.15%).
| Demographics | Rating | Rank | Median Household Income |
| Europeans | 91.2 /100 | #132 | Exceptional $88,751 |
| Immigrants | Ethiopia | 90.9 /100 | #133 | Exceptional $88,687 |
| Swedes | 90.0 /100 | #134 | Exceptional $88,524 |
| Immigrants | Sierra Leone | 89.9 /100 | #135 | Excellent $88,498 |
| Poles | 89.7 /100 | #136 | Excellent $88,472 |
| Sierra Leoneans | 89.6 /100 | #137 | Excellent $88,463 |
| Arabs | 89.2 /100 | #138 | Excellent $88,398 |
| Immigrants | Chile | 89.2 /100 | #139 | Excellent $88,388 |
| Lebanese | 87.2 /100 | #140 | Excellent $88,091 |
| Immigrants | Morocco | 86.0 /100 | #141 | Excellent $87,930 |
| Canadians | 84.7 /100 | #142 | Excellent $87,769 |
| Danes | 83.9 /100 | #143 | Excellent $87,676 |
| Serbians | 83.0 /100 | #144 | Excellent $87,572 |
| Ugandans | 82.9 /100 | #145 | Excellent $87,557 |
| Immigrants | Uganda | 82.8 /100 | #146 | Excellent $87,553 |
Demographics Similar to Venezuelans by Median Household Income
In terms of median household income, the demographic groups most similar to Venezuelans are Salvadoran ($82,449, a difference of 0.020%), Nepalese ($82,410, a difference of 0.030%), Immigrants from Uruguay ($82,560, a difference of 0.16%), Immigrants from Iraq ($82,594, a difference of 0.20%), and Panamanian ($82,272, a difference of 0.20%).
| Demographics | Rating | Rank | Median Household Income |
| Celtics | 22.7 /100 | #205 | Fair $83,193 |
| Immigrants | Kenya | 21.3 /100 | #206 | Fair $83,068 |
| Dutch | 20.3 /100 | #207 | Fair $82,971 |
| French Canadians | 18.7 /100 | #208 | Poor $82,810 |
| Immigrants | Iraq | 16.7 /100 | #209 | Poor $82,594 |
| Immigrants | Uruguay | 16.4 /100 | #210 | Poor $82,560 |
| Salvadorans | 15.4 /100 | #211 | Poor $82,449 |
| Venezuelans | 15.3 /100 | #212 | Poor $82,432 |
| Nepalese | 15.1 /100 | #213 | Poor $82,410 |
| Panamanians | 14.0 /100 | #214 | Poor $82,272 |
| Vietnamese | 13.8 /100 | #215 | Poor $82,248 |
| Yugoslavians | 13.3 /100 | #216 | Poor $82,186 |
| Ecuadorians | 12.5 /100 | #217 | Poor $82,070 |
| Whites/Caucasians | 12.2 /100 | #218 | Poor $82,029 |
| Nigerians | 10.3 /100 | #219 | Poor $81,725 |