Immigrants from North Macedonia vs Cree Median Family Income
COMPARE
Immigrants from North Macedonia
Cree
Median Family Income
Median Family Income Comparison
Immigrants from North Macedonia
Cree
$109,136
MEDIAN FAMILY INCOME
96.4/ 100
METRIC RATING
107th/ 347
METRIC RANK
$90,882
MEDIAN FAMILY INCOME
0.2/ 100
METRIC RATING
268th/ 347
METRIC RANK
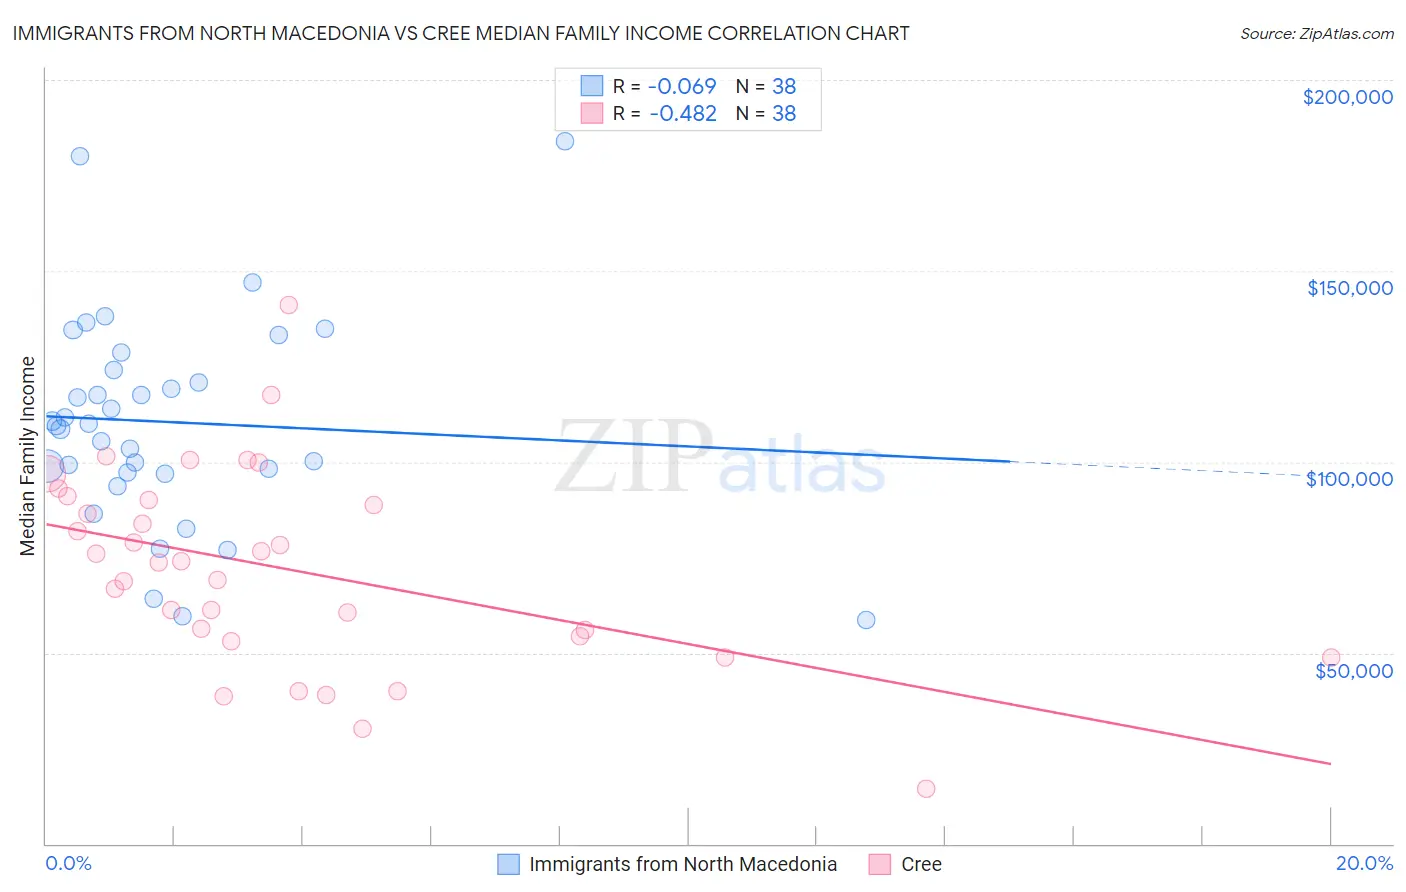
Immigrants from North Macedonia vs Cree Median Family Income Correlation Chart
The statistical analysis conducted on geographies consisting of 74,300,796 people shows a slight negative correlation between the proportion of Immigrants from North Macedonia and median family income in the United States with a correlation coefficient (R) of -0.069 and weighted average of $109,136. Similarly, the statistical analysis conducted on geographies consisting of 76,200,070 people shows a moderate negative correlation between the proportion of Cree and median family income in the United States with a correlation coefficient (R) of -0.482 and weighted average of $90,882, a difference of 20.1%.
Median Family Income Correlation Summary
| Measurement | Immigrants from North Macedonia | Cree |
| Minimum | $58,625 | $14,519 |
| Maximum | $184,091 | $140,987 |
| Range | $125,466 | $126,468 |
| Mean | $110,416 | $71,996 |
| Median | $109,646 | $73,827 |
| Interquartile 25% (IQ1) | $97,322 | $54,375 |
| Interquartile 75% (IQ3) | $124,196 | $90,158 |
| Interquartile Range (IQR) | $26,874 | $35,783 |
| Standard Deviation (Sample) | $27,502 | $25,840 |
| Standard Deviation (Population) | $27,137 | $25,498 |
Similar Demographics by Median Family Income
Demographics Similar to Immigrants from North Macedonia by Median Family Income
In terms of median family income, the demographic groups most similar to Immigrants from North Macedonia are Albanian ($109,136, a difference of 0.0%), Syrian ($109,299, a difference of 0.15%), Palestinian ($109,413, a difference of 0.25%), Immigrants from Brazil ($109,418, a difference of 0.26%), and Immigrants from Zimbabwe ($108,830, a difference of 0.28%).
| Demographics | Rating | Rank | Median Family Income |
| Macedonians | 97.3 /100 | #100 | Exceptional $109,668 |
| Immigrants | Ukraine | 97.2 /100 | #101 | Exceptional $109,645 |
| Assyrians/Chaldeans/Syriacs | 97.2 /100 | #102 | Exceptional $109,622 |
| Immigrants | Brazil | 96.9 /100 | #103 | Exceptional $109,418 |
| Palestinians | 96.9 /100 | #104 | Exceptional $109,413 |
| Syrians | 96.7 /100 | #105 | Exceptional $109,299 |
| Albanians | 96.4 /100 | #106 | Exceptional $109,136 |
| Immigrants | North Macedonia | 96.4 /100 | #107 | Exceptional $109,136 |
| Immigrants | Zimbabwe | 95.9 /100 | #108 | Exceptional $108,830 |
| Immigrants | Afghanistan | 95.6 /100 | #109 | Exceptional $108,709 |
| British | 95.6 /100 | #110 | Exceptional $108,705 |
| Immigrants | Western Asia | 95.6 /100 | #111 | Exceptional $108,691 |
| Immigrants | Poland | 95.3 /100 | #112 | Exceptional $108,570 |
| Immigrants | Saudi Arabia | 95.2 /100 | #113 | Exceptional $108,544 |
| Poles | 95.2 /100 | #114 | Exceptional $108,507 |
Demographics Similar to Cree by Median Family Income
In terms of median family income, the demographic groups most similar to Cree are Belizean ($90,880, a difference of 0.0%), Mexican American Indian ($90,918, a difference of 0.040%), Central American ($91,087, a difference of 0.23%), Jamaican ($90,581, a difference of 0.33%), and Iroquois ($90,543, a difference of 0.37%).
| Demographics | Rating | Rank | Median Family Income |
| Inupiat | 0.4 /100 | #261 | Tragic $91,730 |
| Liberians | 0.4 /100 | #262 | Tragic $91,722 |
| Immigrants | West Indies | 0.3 /100 | #263 | Tragic $91,588 |
| Senegalese | 0.3 /100 | #264 | Tragic $91,475 |
| Hmong | 0.3 /100 | #265 | Tragic $91,296 |
| Central Americans | 0.3 /100 | #266 | Tragic $91,087 |
| Mexican American Indians | 0.2 /100 | #267 | Tragic $90,918 |
| Cree | 0.2 /100 | #268 | Tragic $90,882 |
| Belizeans | 0.2 /100 | #269 | Tragic $90,880 |
| Jamaicans | 0.2 /100 | #270 | Tragic $90,581 |
| Iroquois | 0.2 /100 | #271 | Tragic $90,543 |
| Immigrants | Liberia | 0.2 /100 | #272 | Tragic $90,450 |
| Immigrants | Micronesia | 0.2 /100 | #273 | Tragic $90,345 |
| Spanish Americans | 0.2 /100 | #274 | Tragic $90,322 |
| Immigrants | St. Vincent and the Grenadines | 0.2 /100 | #275 | Tragic $90,094 |