Immigrants from North Macedonia vs Cree Unemployment Among Women with Children Under 18 years
COMPARE
Immigrants from North Macedonia
Cree
Unemployment Among Women with Children Under 18 years
Unemployment Among Women with Children Under 18 years Comparison
Immigrants from North Macedonia
Cree
5.3%
UNEMPLOYMENT AMONG WOMEN WITH CHILDREN UNDER 18 YEARS
83.2/ 100
METRIC RATING
125th/ 347
METRIC RANK
6.3%
UNEMPLOYMENT AMONG WOMEN WITH CHILDREN UNDER 18 YEARS
0.0/ 100
METRIC RATING
288th/ 347
METRIC RANK
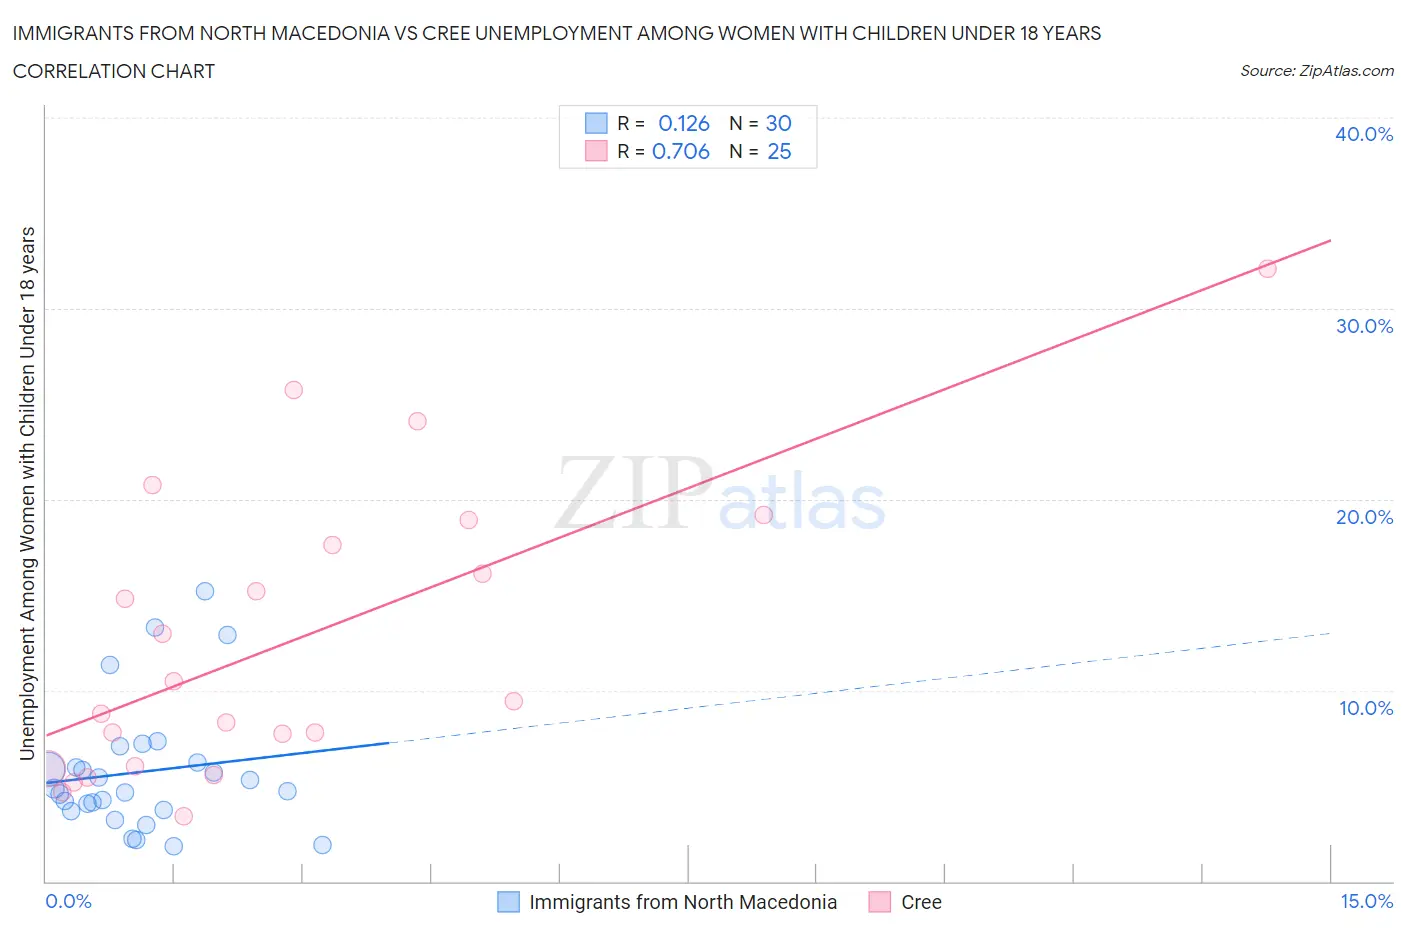
Immigrants from North Macedonia vs Cree Unemployment Among Women with Children Under 18 years Correlation Chart
The statistical analysis conducted on geographies consisting of 73,339,678 people shows a poor positive correlation between the proportion of Immigrants from North Macedonia and unemployment rate among women with children under the age of 18 in the United States with a correlation coefficient (R) of 0.126 and weighted average of 5.3%. Similarly, the statistical analysis conducted on geographies consisting of 75,145,455 people shows a strong positive correlation between the proportion of Cree and unemployment rate among women with children under the age of 18 in the United States with a correlation coefficient (R) of 0.706 and weighted average of 6.3%, a difference of 19.8%.
Unemployment Among Women with Children Under 18 years Correlation Summary
| Measurement | Immigrants from North Macedonia | Cree |
| Minimum | 1.9% | 3.4% |
| Maximum | 15.2% | 32.1% |
| Range | 13.3% | 28.7% |
| Mean | 5.7% | 12.6% |
| Median | 4.8% | 9.4% |
| Interquartile 25% (IQ1) | 3.7% | 5.9% |
| Interquartile 75% (IQ3) | 6.2% | 18.2% |
| Interquartile Range (IQR) | 2.5% | 12.3% |
| Standard Deviation (Sample) | 3.4% | 7.6% |
| Standard Deviation (Population) | 3.3% | 7.5% |
Similar Demographics by Unemployment Among Women with Children Under 18 years
Demographics Similar to Immigrants from North Macedonia by Unemployment Among Women with Children Under 18 years
In terms of unemployment among women with children under 18 years, the demographic groups most similar to Immigrants from North Macedonia are Immigrants from Oceania (5.3%, a difference of 0.010%), White/Caucasian (5.3%, a difference of 0.040%), Immigrants from South Africa (5.3%, a difference of 0.050%), Native Hawaiian (5.3%, a difference of 0.11%), and Immigrants from Italy (5.3%, a difference of 0.11%).
| Demographics | Rating | Rank | Unemployment Among Women with Children Under 18 years |
| Immigrants | Europe | 86.7 /100 | #118 | Excellent 5.3% |
| Basques | 86.5 /100 | #119 | Excellent 5.3% |
| Egyptians | 86.4 /100 | #120 | Excellent 5.3% |
| Immigrants | Romania | 85.8 /100 | #121 | Excellent 5.3% |
| Scotch-Irish | 85.7 /100 | #122 | Excellent 5.3% |
| Sudanese | 84.3 /100 | #123 | Excellent 5.3% |
| Native Hawaiians | 84.0 /100 | #124 | Excellent 5.3% |
| Immigrants | North Macedonia | 83.2 /100 | #125 | Excellent 5.3% |
| Immigrants | Oceania | 83.1 /100 | #126 | Excellent 5.3% |
| Whites/Caucasians | 82.9 /100 | #127 | Excellent 5.3% |
| Immigrants | South Africa | 82.8 /100 | #128 | Excellent 5.3% |
| Immigrants | Italy | 82.3 /100 | #129 | Excellent 5.3% |
| Immigrants | Austria | 82.1 /100 | #130 | Excellent 5.3% |
| Immigrants | Israel | 81.9 /100 | #131 | Excellent 5.3% |
| Immigrants | Ethiopia | 81.4 /100 | #132 | Excellent 5.3% |
Demographics Similar to Cree by Unemployment Among Women with Children Under 18 years
In terms of unemployment among women with children under 18 years, the demographic groups most similar to Cree are Kiowa (6.3%, a difference of 0.12%), Alaskan Athabascan (6.3%, a difference of 0.13%), Bahamian (6.3%, a difference of 0.28%), Immigrants from Caribbean (6.4%, a difference of 0.36%), and Blackfeet (6.4%, a difference of 0.40%).
| Demographics | Rating | Rank | Unemployment Among Women with Children Under 18 years |
| Immigrants | El Salvador | 0.0 /100 | #281 | Tragic 6.3% |
| Immigrants | St. Vincent and the Grenadines | 0.0 /100 | #282 | Tragic 6.3% |
| West Indians | 0.0 /100 | #283 | Tragic 6.3% |
| Immigrants | Grenada | 0.0 /100 | #284 | Tragic 6.3% |
| Bahamians | 0.0 /100 | #285 | Tragic 6.3% |
| Alaskan Athabascans | 0.0 /100 | #286 | Tragic 6.3% |
| Kiowa | 0.0 /100 | #287 | Tragic 6.3% |
| Cree | 0.0 /100 | #288 | Tragic 6.3% |
| Immigrants | Caribbean | 0.0 /100 | #289 | Tragic 6.4% |
| Blackfeet | 0.0 /100 | #290 | Tragic 6.4% |
| Immigrants | Guatemala | 0.0 /100 | #291 | Tragic 6.4% |
| Mexicans | 0.0 /100 | #292 | Tragic 6.4% |
| Immigrants | Bangladesh | 0.0 /100 | #293 | Tragic 6.4% |
| Hondurans | 0.0 /100 | #294 | Tragic 6.4% |
| Barbadians | 0.0 /100 | #295 | Tragic 6.4% |