Immigrants from North America vs Immigrants from Saudi Arabia Householder Income Ages 45 - 64 years
COMPARE
Immigrants from North America
Immigrants from Saudi Arabia
Householder Income Ages 45 - 64 years
Householder Income Ages 45 - 64 years Comparison
Immigrants from North America
Immigrants from Saudi Arabia
$109,198
HOUSEHOLDER INCOME AGES 45 - 64 YEARS
98.8/ 100
METRIC RATING
82nd/ 347
METRIC RANK
$105,249
HOUSEHOLDER INCOME AGES 45 - 64 YEARS
92.2/ 100
METRIC RATING
127th/ 347
METRIC RANK
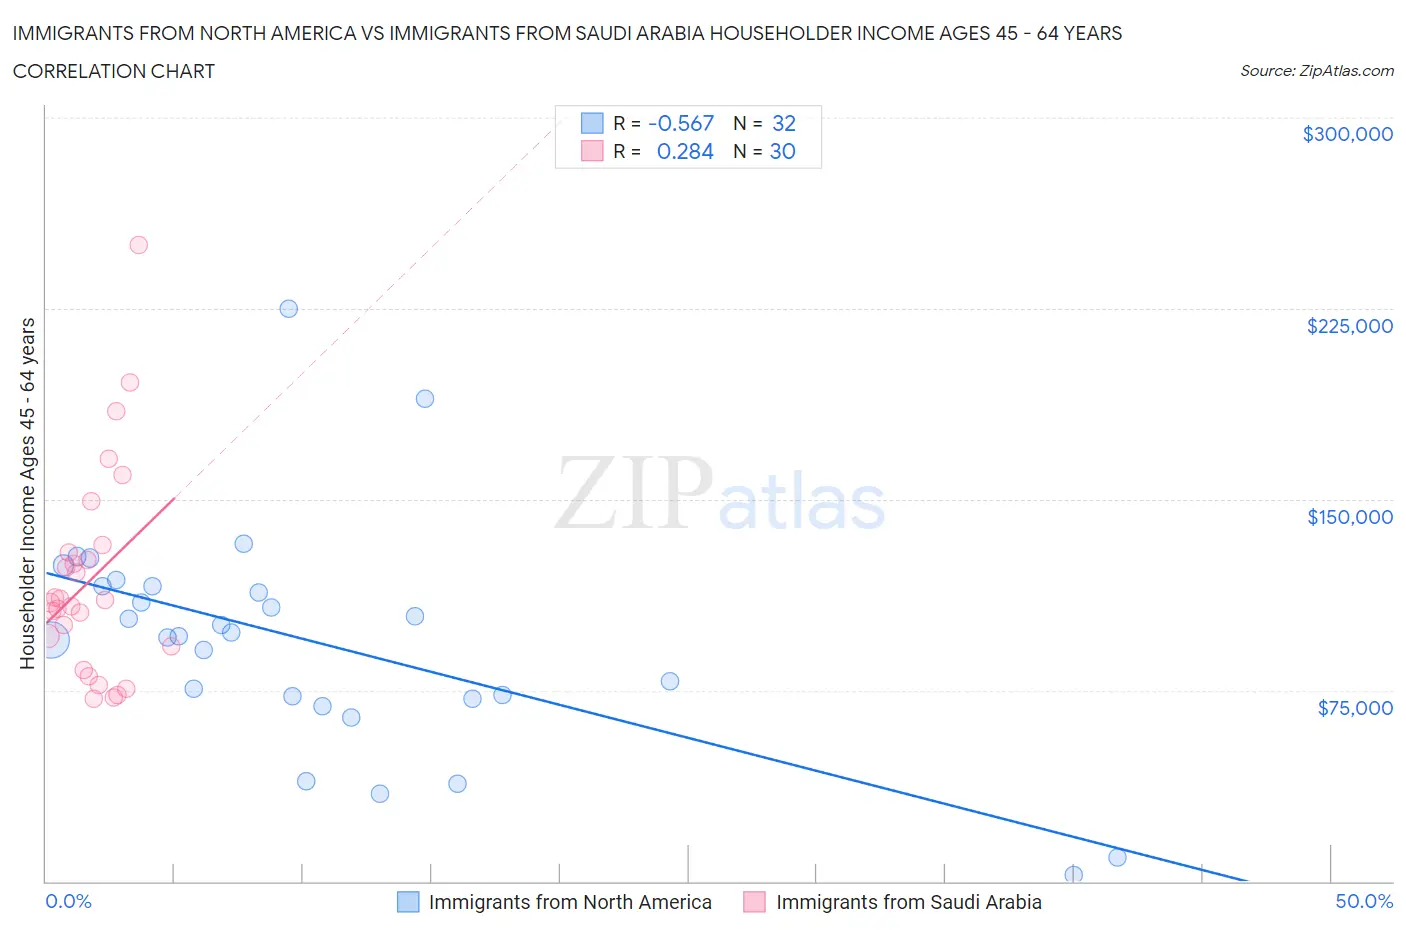
Immigrants from North America vs Immigrants from Saudi Arabia Householder Income Ages 45 - 64 years Correlation Chart
The statistical analysis conducted on geographies consisting of 461,409,956 people shows a substantial negative correlation between the proportion of Immigrants from North America and household income with householder between the ages 45 and 64 in the United States with a correlation coefficient (R) of -0.567 and weighted average of $109,198. Similarly, the statistical analysis conducted on geographies consisting of 164,122,820 people shows a weak positive correlation between the proportion of Immigrants from Saudi Arabia and household income with householder between the ages 45 and 64 in the United States with a correlation coefficient (R) of 0.284 and weighted average of $105,249, a difference of 3.7%.
Householder Income Ages 45 - 64 years Correlation Summary
| Measurement | Immigrants from North America | Immigrants from Saudi Arabia |
| Minimum | $2,499 | $71,471 |
| Maximum | $225,000 | $250,001 |
| Range | $222,501 | $178,530 |
| Mean | $94,322 | $118,389 |
| Median | $96,912 | $109,917 |
| Interquartile 25% (IQ1) | $72,197 | $92,091 |
| Interquartile 75% (IQ3) | $115,910 | $128,959 |
| Interquartile Range (IQR) | $43,714 | $36,868 |
| Standard Deviation (Sample) | $44,789 | $40,687 |
| Standard Deviation (Population) | $44,084 | $40,003 |
Similar Demographics by Householder Income Ages 45 - 64 years
Demographics Similar to Immigrants from North America by Householder Income Ages 45 - 64 years
In terms of householder income ages 45 - 64 years, the demographic groups most similar to Immigrants from North America are Immigrants from Eastern Europe ($109,335, a difference of 0.12%), Immigrants from Spain ($109,051, a difference of 0.14%), Jordanian ($109,376, a difference of 0.16%), Immigrants from Bulgaria ($109,379, a difference of 0.17%), and Immigrants from Canada ($109,402, a difference of 0.19%).
| Demographics | Rating | Rank | Householder Income Ages 45 - 64 years |
| South Africans | 99.1 /100 | #75 | Exceptional $109,719 |
| Paraguayans | 99.0 /100 | #76 | Exceptional $109,447 |
| Immigrants | England | 99.0 /100 | #77 | Exceptional $109,446 |
| Immigrants | Canada | 99.0 /100 | #78 | Exceptional $109,402 |
| Immigrants | Bulgaria | 98.9 /100 | #79 | Exceptional $109,379 |
| Jordanians | 98.9 /100 | #80 | Exceptional $109,376 |
| Immigrants | Eastern Europe | 98.9 /100 | #81 | Exceptional $109,335 |
| Immigrants | North America | 98.8 /100 | #82 | Exceptional $109,198 |
| Immigrants | Spain | 98.8 /100 | #83 | Exceptional $109,051 |
| Immigrants | Western Europe | 98.6 /100 | #84 | Exceptional $108,824 |
| Immigrants | Afghanistan | 98.6 /100 | #85 | Exceptional $108,785 |
| Austrians | 98.5 /100 | #86 | Exceptional $108,692 |
| Tongans | 98.5 /100 | #87 | Exceptional $108,643 |
| Romanians | 98.5 /100 | #88 | Exceptional $108,609 |
| Ukrainians | 98.3 /100 | #89 | Exceptional $108,475 |
Demographics Similar to Immigrants from Saudi Arabia by Householder Income Ages 45 - 64 years
In terms of householder income ages 45 - 64 years, the demographic groups most similar to Immigrants from Saudi Arabia are Pakistani ($105,317, a difference of 0.060%), Portuguese ($105,309, a difference of 0.060%), Native Hawaiian ($105,149, a difference of 0.090%), Immigrants from Northern Africa ($105,430, a difference of 0.17%), and Peruvian ($105,070, a difference of 0.17%).
| Demographics | Rating | Rank | Householder Income Ages 45 - 64 years |
| Immigrants | South Eastern Asia | 94.8 /100 | #120 | Exceptional $106,109 |
| Poles | 94.4 /100 | #121 | Exceptional $105,952 |
| Immigrants | North Macedonia | 94.2 /100 | #122 | Exceptional $105,892 |
| Danes | 93.4 /100 | #123 | Exceptional $105,619 |
| Immigrants | Northern Africa | 92.8 /100 | #124 | Exceptional $105,430 |
| Pakistanis | 92.4 /100 | #125 | Exceptional $105,317 |
| Portuguese | 92.4 /100 | #126 | Exceptional $105,309 |
| Immigrants | Saudi Arabia | 92.2 /100 | #127 | Exceptional $105,249 |
| Native Hawaiians | 91.8 /100 | #128 | Exceptional $105,149 |
| Peruvians | 91.5 /100 | #129 | Exceptional $105,070 |
| Immigrants | Zimbabwe | 91.2 /100 | #130 | Exceptional $104,992 |
| Immigrants | Syria | 90.7 /100 | #131 | Exceptional $104,858 |
| Lebanese | 90.1 /100 | #132 | Exceptional $104,734 |
| Arabs | 89.3 /100 | #133 | Excellent $104,566 |
| Canadians | 89.3 /100 | #134 | Excellent $104,560 |