Russian vs Immigrants from Saudi Arabia Householder Income Ages 45 - 64 years
COMPARE
Russian
Immigrants from Saudi Arabia
Householder Income Ages 45 - 64 years
Householder Income Ages 45 - 64 years Comparison
Russians
Immigrants from Saudi Arabia
$116,328
HOUSEHOLDER INCOME AGES 45 - 64 YEARS
100.0/ 100
METRIC RATING
32nd/ 347
METRIC RANK
$105,249
HOUSEHOLDER INCOME AGES 45 - 64 YEARS
92.2/ 100
METRIC RATING
127th/ 347
METRIC RANK
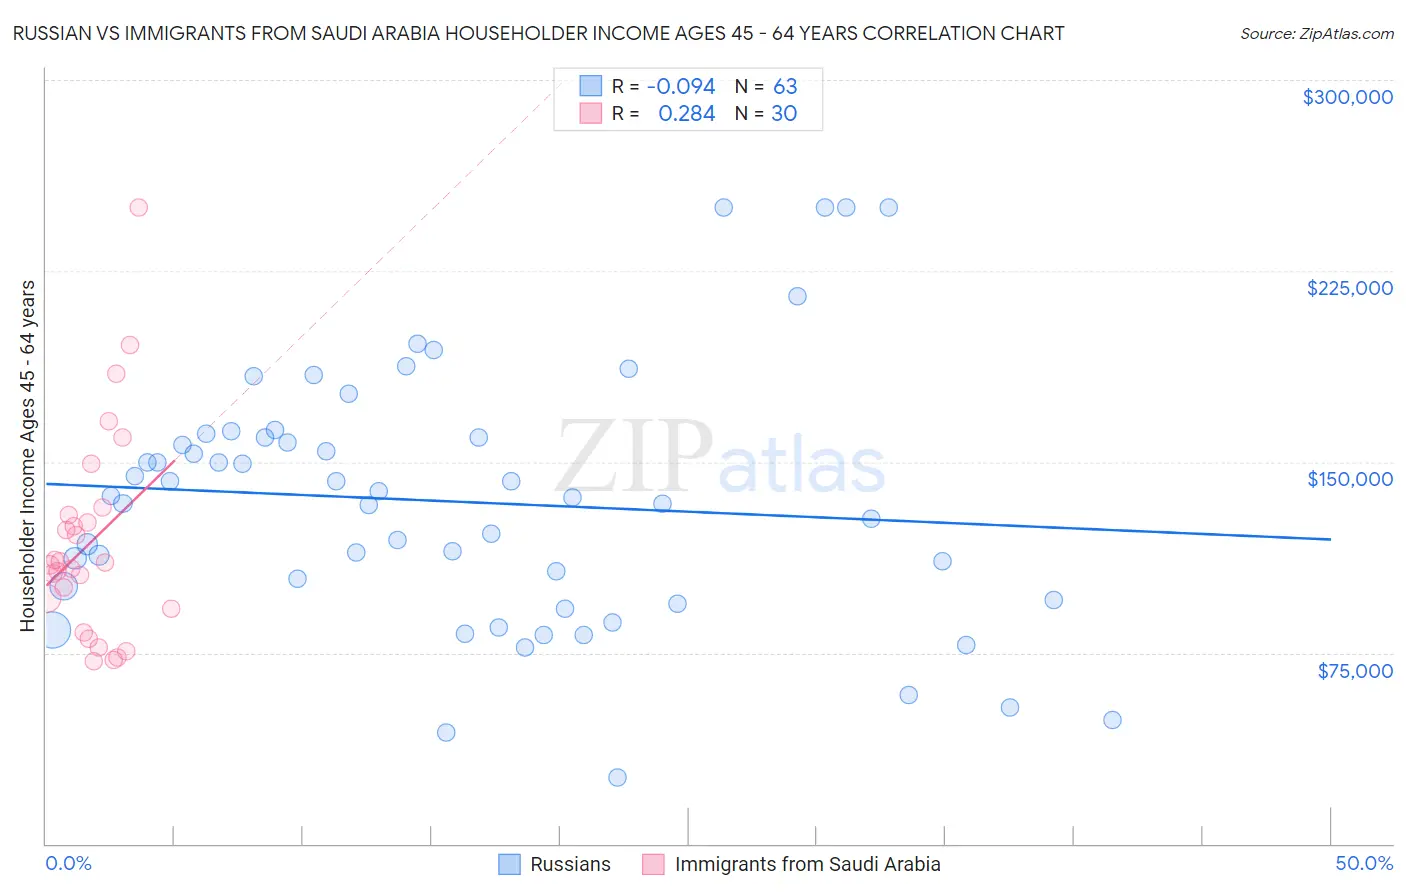
Russian vs Immigrants from Saudi Arabia Householder Income Ages 45 - 64 years Correlation Chart
The statistical analysis conducted on geographies consisting of 510,398,686 people shows a slight negative correlation between the proportion of Russians and household income with householder between the ages 45 and 64 in the United States with a correlation coefficient (R) of -0.094 and weighted average of $116,328. Similarly, the statistical analysis conducted on geographies consisting of 164,122,820 people shows a weak positive correlation between the proportion of Immigrants from Saudi Arabia and household income with householder between the ages 45 and 64 in the United States with a correlation coefficient (R) of 0.284 and weighted average of $105,249, a difference of 10.5%.
Householder Income Ages 45 - 64 years Correlation Summary
| Measurement | Russian | Immigrants from Saudi Arabia |
| Minimum | $26,250 | $71,471 |
| Maximum | $250,001 | $250,001 |
| Range | $223,751 | $178,530 |
| Mean | $134,377 | $118,389 |
| Median | $136,249 | $109,917 |
| Interquartile 25% (IQ1) | $95,750 | $92,091 |
| Interquartile 75% (IQ3) | $159,669 | $128,959 |
| Interquartile Range (IQR) | $63,919 | $36,868 |
| Standard Deviation (Sample) | $50,536 | $40,687 |
| Standard Deviation (Population) | $50,133 | $40,003 |
Similar Demographics by Householder Income Ages 45 - 64 years
Demographics Similar to Russians by Householder Income Ages 45 - 64 years
In terms of householder income ages 45 - 64 years, the demographic groups most similar to Russians are Chinese ($116,156, a difference of 0.15%), Immigrants from Asia ($116,566, a difference of 0.20%), Immigrants from Denmark ($116,000, a difference of 0.28%), Latvian ($115,957, a difference of 0.32%), and Immigrants from Switzerland ($115,934, a difference of 0.34%).
| Demographics | Rating | Rank | Householder Income Ages 45 - 64 years |
| Asians | 100.0 /100 | #25 | Exceptional $118,426 |
| Immigrants | Sweden | 100.0 /100 | #26 | Exceptional $118,318 |
| Immigrants | Northern Europe | 100.0 /100 | #27 | Exceptional $117,930 |
| Turks | 100.0 /100 | #28 | Exceptional $117,814 |
| Bhutanese | 100.0 /100 | #29 | Exceptional $117,750 |
| Immigrants | Bolivia | 100.0 /100 | #30 | Exceptional $117,731 |
| Immigrants | Asia | 100.0 /100 | #31 | Exceptional $116,566 |
| Russians | 100.0 /100 | #32 | Exceptional $116,328 |
| Chinese | 100.0 /100 | #33 | Exceptional $116,156 |
| Immigrants | Denmark | 100.0 /100 | #34 | Exceptional $116,000 |
| Latvians | 100.0 /100 | #35 | Exceptional $115,957 |
| Immigrants | Switzerland | 100.0 /100 | #36 | Exceptional $115,934 |
| Maltese | 99.9 /100 | #37 | Exceptional $114,754 |
| Immigrants | Pakistan | 99.9 /100 | #38 | Exceptional $114,434 |
| Immigrants | Turkey | 99.9 /100 | #39 | Exceptional $114,407 |
Demographics Similar to Immigrants from Saudi Arabia by Householder Income Ages 45 - 64 years
In terms of householder income ages 45 - 64 years, the demographic groups most similar to Immigrants from Saudi Arabia are Pakistani ($105,317, a difference of 0.060%), Portuguese ($105,309, a difference of 0.060%), Native Hawaiian ($105,149, a difference of 0.090%), Immigrants from Northern Africa ($105,430, a difference of 0.17%), and Peruvian ($105,070, a difference of 0.17%).
| Demographics | Rating | Rank | Householder Income Ages 45 - 64 years |
| Immigrants | South Eastern Asia | 94.8 /100 | #120 | Exceptional $106,109 |
| Poles | 94.4 /100 | #121 | Exceptional $105,952 |
| Immigrants | North Macedonia | 94.2 /100 | #122 | Exceptional $105,892 |
| Danes | 93.4 /100 | #123 | Exceptional $105,619 |
| Immigrants | Northern Africa | 92.8 /100 | #124 | Exceptional $105,430 |
| Pakistanis | 92.4 /100 | #125 | Exceptional $105,317 |
| Portuguese | 92.4 /100 | #126 | Exceptional $105,309 |
| Immigrants | Saudi Arabia | 92.2 /100 | #127 | Exceptional $105,249 |
| Native Hawaiians | 91.8 /100 | #128 | Exceptional $105,149 |
| Peruvians | 91.5 /100 | #129 | Exceptional $105,070 |
| Immigrants | Zimbabwe | 91.2 /100 | #130 | Exceptional $104,992 |
| Immigrants | Syria | 90.7 /100 | #131 | Exceptional $104,858 |
| Lebanese | 90.1 /100 | #132 | Exceptional $104,734 |
| Arabs | 89.3 /100 | #133 | Excellent $104,566 |
| Canadians | 89.3 /100 | #134 | Excellent $104,560 |