Immigrants from Ecuador vs Immigrants from Norway Median Male Earnings
COMPARE
Immigrants from Ecuador
Immigrants from Norway
Median Male Earnings
Median Male Earnings Comparison
Immigrants from Ecuador
Immigrants from Norway
$50,474
MEDIAN MALE EARNINGS
1.9/ 100
METRIC RATING
246th/ 347
METRIC RANK
$61,628
MEDIAN MALE EARNINGS
99.9/ 100
METRIC RATING
52nd/ 347
METRIC RANK
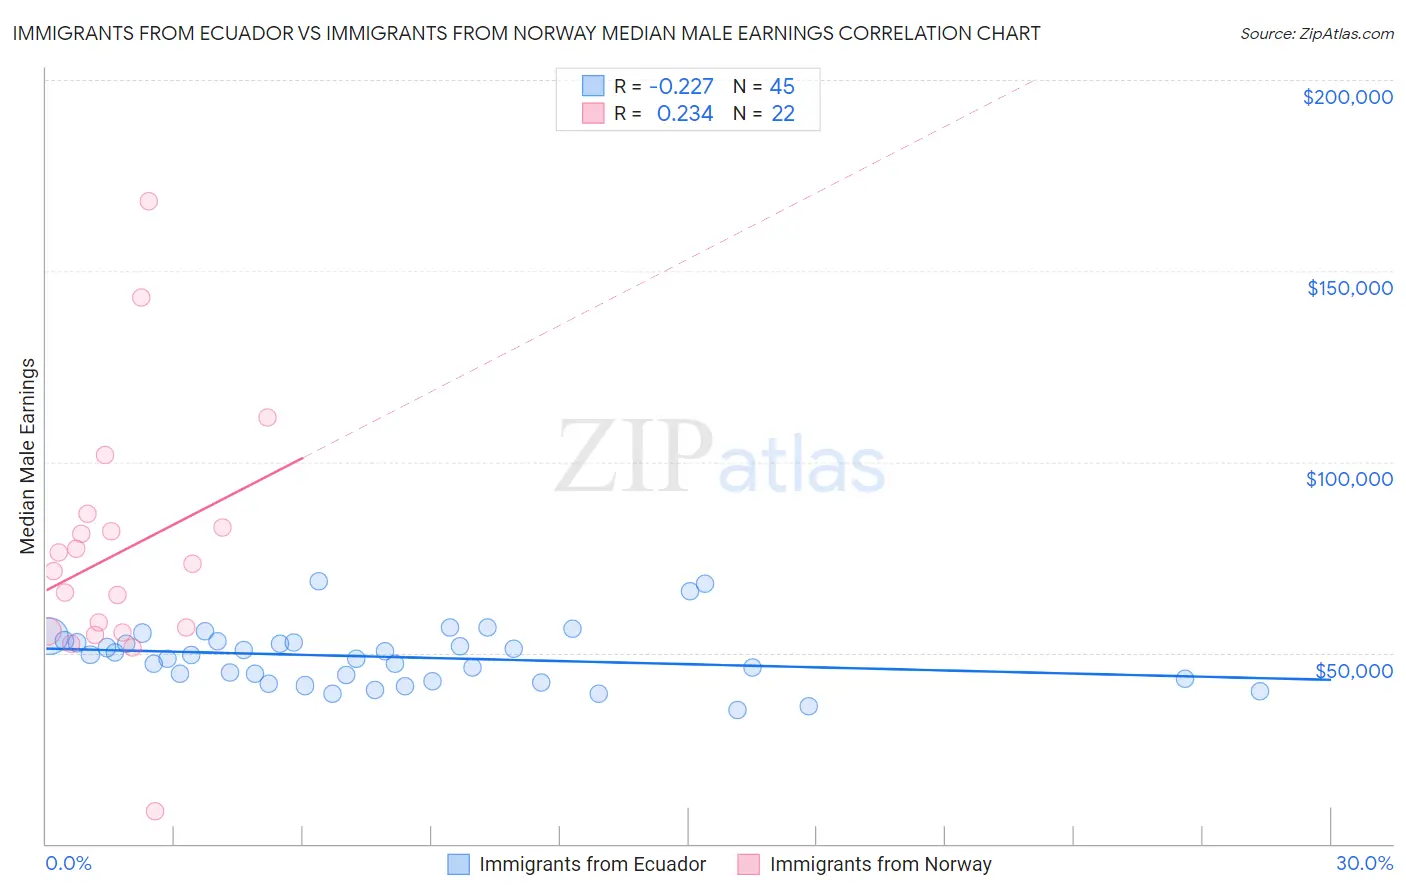
Immigrants from Ecuador vs Immigrants from Norway Median Male Earnings Correlation Chart
The statistical analysis conducted on geographies consisting of 270,963,841 people shows a weak negative correlation between the proportion of Immigrants from Ecuador and median male earnings in the United States with a correlation coefficient (R) of -0.227 and weighted average of $50,474. Similarly, the statistical analysis conducted on geographies consisting of 116,702,945 people shows a weak positive correlation between the proportion of Immigrants from Norway and median male earnings in the United States with a correlation coefficient (R) of 0.234 and weighted average of $61,628, a difference of 22.1%.
Median Male Earnings Correlation Summary
| Measurement | Immigrants from Ecuador | Immigrants from Norway |
| Minimum | $35,014 | $8,547 |
| Maximum | $68,684 | $168,268 |
| Range | $33,670 | $159,721 |
| Mean | $48,933 | $76,311 |
| Median | $49,320 | $72,426 |
| Interquartile 25% (IQ1) | $42,981 | $55,593 |
| Interquartile 75% (IQ3) | $52,866 | $82,963 |
| Interquartile Range (IQR) | $9,884 | $27,370 |
| Standard Deviation (Sample) | $7,606 | $33,202 |
| Standard Deviation (Population) | $7,521 | $32,439 |
Similar Demographics by Median Male Earnings
Demographics Similar to Immigrants from Ecuador by Median Male Earnings
In terms of median male earnings, the demographic groups most similar to Immigrants from Ecuador are Hawaiian ($50,488, a difference of 0.030%), Subsaharan African ($50,408, a difference of 0.13%), Houma ($50,547, a difference of 0.14%), Guyanese ($50,613, a difference of 0.27%), and French American Indian ($50,611, a difference of 0.27%).
| Demographics | Rating | Rank | Median Male Earnings |
| Americans | 2.5 /100 | #239 | Tragic $50,761 |
| West Indians | 2.3 /100 | #240 | Tragic $50,682 |
| Immigrants | St. Vincent and the Grenadines | 2.3 /100 | #241 | Tragic $50,665 |
| Guyanese | 2.2 /100 | #242 | Tragic $50,613 |
| French American Indians | 2.2 /100 | #243 | Tragic $50,611 |
| Houma | 2.0 /100 | #244 | Tragic $50,547 |
| Hawaiians | 1.9 /100 | #245 | Tragic $50,488 |
| Immigrants | Ecuador | 1.9 /100 | #246 | Tragic $50,474 |
| Sub-Saharan Africans | 1.8 /100 | #247 | Tragic $50,408 |
| Immigrants | Guyana | 1.6 /100 | #248 | Tragic $50,321 |
| Immigrants | Burma/Myanmar | 1.6 /100 | #249 | Tragic $50,298 |
| Osage | 1.6 /100 | #250 | Tragic $50,292 |
| Immigrants | Grenada | 1.6 /100 | #251 | Tragic $50,279 |
| Immigrants | Cabo Verde | 1.2 /100 | #252 | Tragic $50,009 |
| German Russians | 1.1 /100 | #253 | Tragic $49,924 |
Demographics Similar to Immigrants from Norway by Median Male Earnings
In terms of median male earnings, the demographic groups most similar to Immigrants from Norway are Estonian ($61,710, a difference of 0.13%), Bhutanese ($61,759, a difference of 0.21%), South African ($61,460, a difference of 0.27%), Immigrants from Latvia ($61,422, a difference of 0.34%), and Greek ($61,242, a difference of 0.63%).
| Demographics | Rating | Rank | Median Male Earnings |
| Bulgarians | 100.0 /100 | #45 | Exceptional $62,378 |
| Immigrants | Czechoslovakia | 99.9 /100 | #46 | Exceptional $62,217 |
| Immigrants | Austria | 99.9 /100 | #47 | Exceptional $62,164 |
| Immigrants | Malaysia | 99.9 /100 | #48 | Exceptional $62,121 |
| Immigrants | Europe | 99.9 /100 | #49 | Exceptional $62,057 |
| Bhutanese | 99.9 /100 | #50 | Exceptional $61,759 |
| Estonians | 99.9 /100 | #51 | Exceptional $61,710 |
| Immigrants | Norway | 99.9 /100 | #52 | Exceptional $61,628 |
| South Africans | 99.9 /100 | #53 | Exceptional $61,460 |
| Immigrants | Latvia | 99.9 /100 | #54 | Exceptional $61,422 |
| Greeks | 99.9 /100 | #55 | Exceptional $61,242 |
| Lithuanians | 99.9 /100 | #56 | Exceptional $61,228 |
| Immigrants | Scotland | 99.9 /100 | #57 | Exceptional $61,220 |
| New Zealanders | 99.9 /100 | #58 | Exceptional $61,199 |
| Immigrants | Netherlands | 99.8 /100 | #59 | Exceptional $61,096 |