Immigrants from Morocco vs Moroccan 12th Grade, No Diploma
COMPARE
Immigrants from Morocco
Moroccan
12th Grade, No Diploma
12th Grade, No Diploma Comparison
Immigrants from Morocco
Moroccans
91.2%
12TH GRADE, NO DIPLOMA
51.4/ 100
METRIC RATING
171st/ 347
METRIC RANK
90.9%
12TH GRADE, NO DIPLOMA
28.8/ 100
METRIC RATING
191st/ 347
METRIC RANK
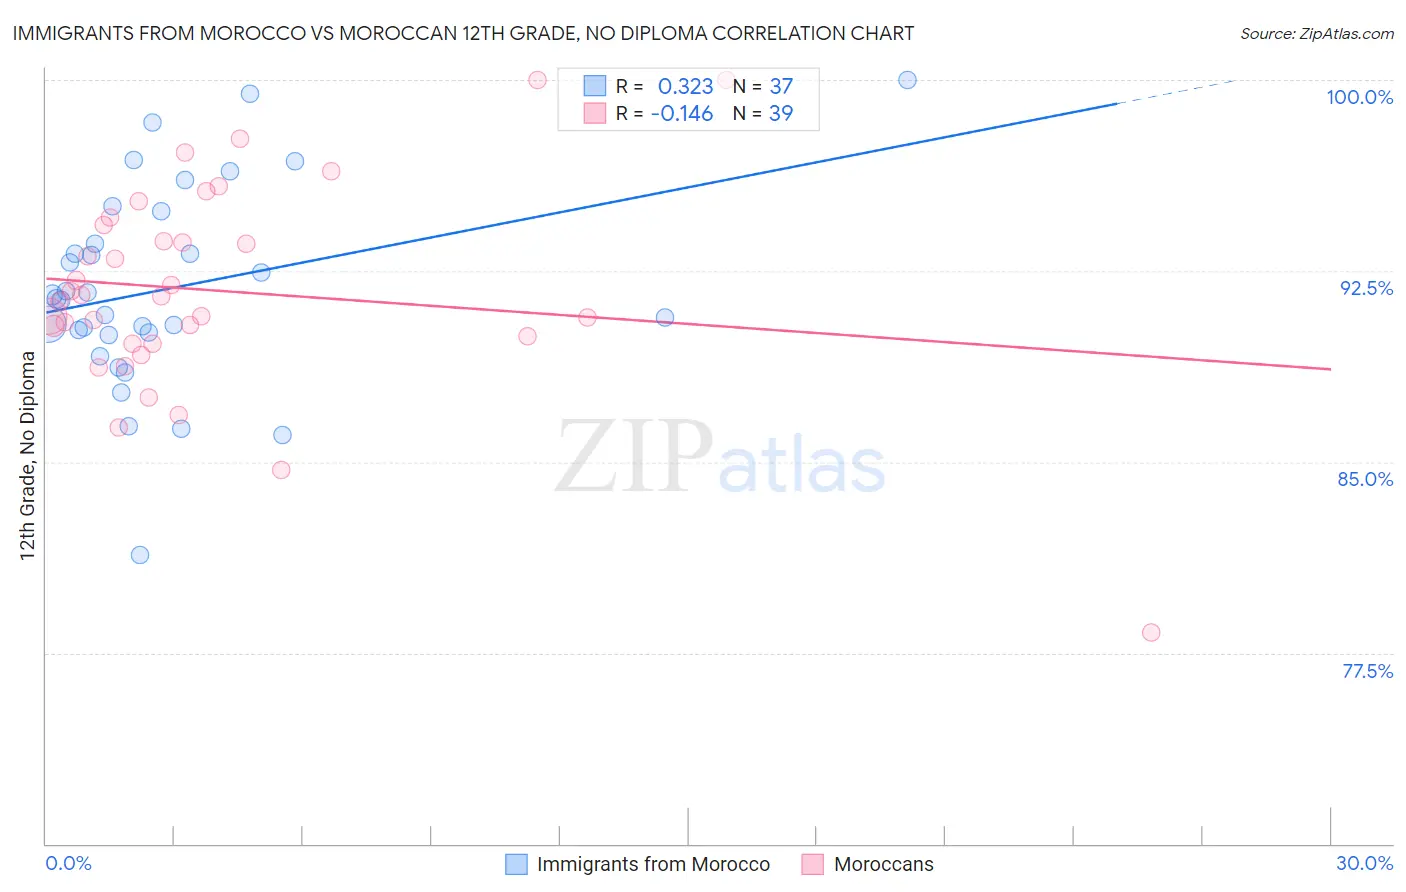
Immigrants from Morocco vs Moroccan 12th Grade, No Diploma Correlation Chart
The statistical analysis conducted on geographies consisting of 178,912,438 people shows a mild positive correlation between the proportion of Immigrants from Morocco and percentage of population with at least 12th grade (no diploma) education in the United States with a correlation coefficient (R) of 0.323 and weighted average of 91.2%. Similarly, the statistical analysis conducted on geographies consisting of 201,817,667 people shows a poor negative correlation between the proportion of Moroccans and percentage of population with at least 12th grade (no diploma) education in the United States with a correlation coefficient (R) of -0.146 and weighted average of 90.9%, a difference of 0.30%.
12th Grade, No Diploma Correlation Summary
| Measurement | Immigrants from Morocco | Moroccan |
| Minimum | 81.3% | 78.3% |
| Maximum | 100.0% | 100.0% |
| Range | 18.7% | 21.7% |
| Mean | 91.8% | 91.7% |
| Median | 91.4% | 91.5% |
| Interquartile 25% (IQ1) | 90.1% | 89.7% |
| Interquartile 75% (IQ3) | 94.2% | 94.3% |
| Interquartile Range (IQR) | 4.2% | 4.6% |
| Standard Deviation (Sample) | 3.9% | 4.1% |
| Standard Deviation (Population) | 3.9% | 4.1% |
Demographics Similar to Immigrants from Morocco and Moroccans by 12th Grade, No Diploma
In terms of 12th grade, no diploma, the demographic groups most similar to Immigrants from Morocco are Bermudan (91.2%, a difference of 0.010%), Bolivian (91.2%, a difference of 0.010%), Immigrants from Nepal (91.2%, a difference of 0.020%), Immigrants from Western Asia (91.2%, a difference of 0.030%), and Iroquois (91.1%, a difference of 0.040%). Similarly, the demographic groups most similar to Moroccans are Afghan (90.9%, a difference of 0.010%), Immigrants from Uganda (90.9%, a difference of 0.040%), American (91.0%, a difference of 0.050%), Potawatomi (91.0%, a difference of 0.060%), and Ethiopian (91.0%, a difference of 0.070%).
| Demographics | Rating | Rank | 12th Grade, No Diploma |
| Immigrants | Morocco | 51.4 /100 | #171 | Average 91.2% |
| Bermudans | 50.8 /100 | #172 | Average 91.2% |
| Bolivians | 50.4 /100 | #173 | Average 91.2% |
| Immigrants | Nepal | 50.0 /100 | #174 | Average 91.2% |
| Immigrants | Western Asia | 49.0 /100 | #175 | Average 91.2% |
| Iroquois | 48.5 /100 | #176 | Average 91.1% |
| Sierra Leoneans | 47.7 /100 | #177 | Average 91.1% |
| Spanish | 43.7 /100 | #178 | Average 91.1% |
| Immigrants | Chile | 43.3 /100 | #179 | Average 91.1% |
| Immigrants | Syria | 40.3 /100 | #180 | Average 91.1% |
| Guamanians/Chamorros | 39.5 /100 | #181 | Fair 91.0% |
| Immigrants | Nonimmigrants | 38.8 /100 | #182 | Fair 91.0% |
| Osage | 38.3 /100 | #183 | Fair 91.0% |
| Spaniards | 36.2 /100 | #184 | Fair 91.0% |
| Sudanese | 34.4 /100 | #185 | Fair 91.0% |
| Ethiopians | 33.9 /100 | #186 | Fair 91.0% |
| Potawatomi | 32.9 /100 | #187 | Fair 91.0% |
| Americans | 32.6 /100 | #188 | Fair 91.0% |
| Immigrants | Uganda | 31.6 /100 | #189 | Fair 90.9% |
| Afghans | 29.9 /100 | #190 | Fair 90.9% |
| Moroccans | 28.8 /100 | #191 | Fair 90.9% |