Bermudan vs German Russian Householder Income Under 25 years
COMPARE
Bermudan
German Russian
Householder Income Under 25 years
Householder Income Under 25 years Comparison
Bermudans
German Russians
$47,359
HOUSEHOLDER INCOME UNDER 25 YEARS
0.0/ 100
METRIC RATING
312th/ 347
METRIC RANK
$45,673
HOUSEHOLDER INCOME UNDER 25 YEARS
0.0/ 100
METRIC RATING
328th/ 347
METRIC RANK
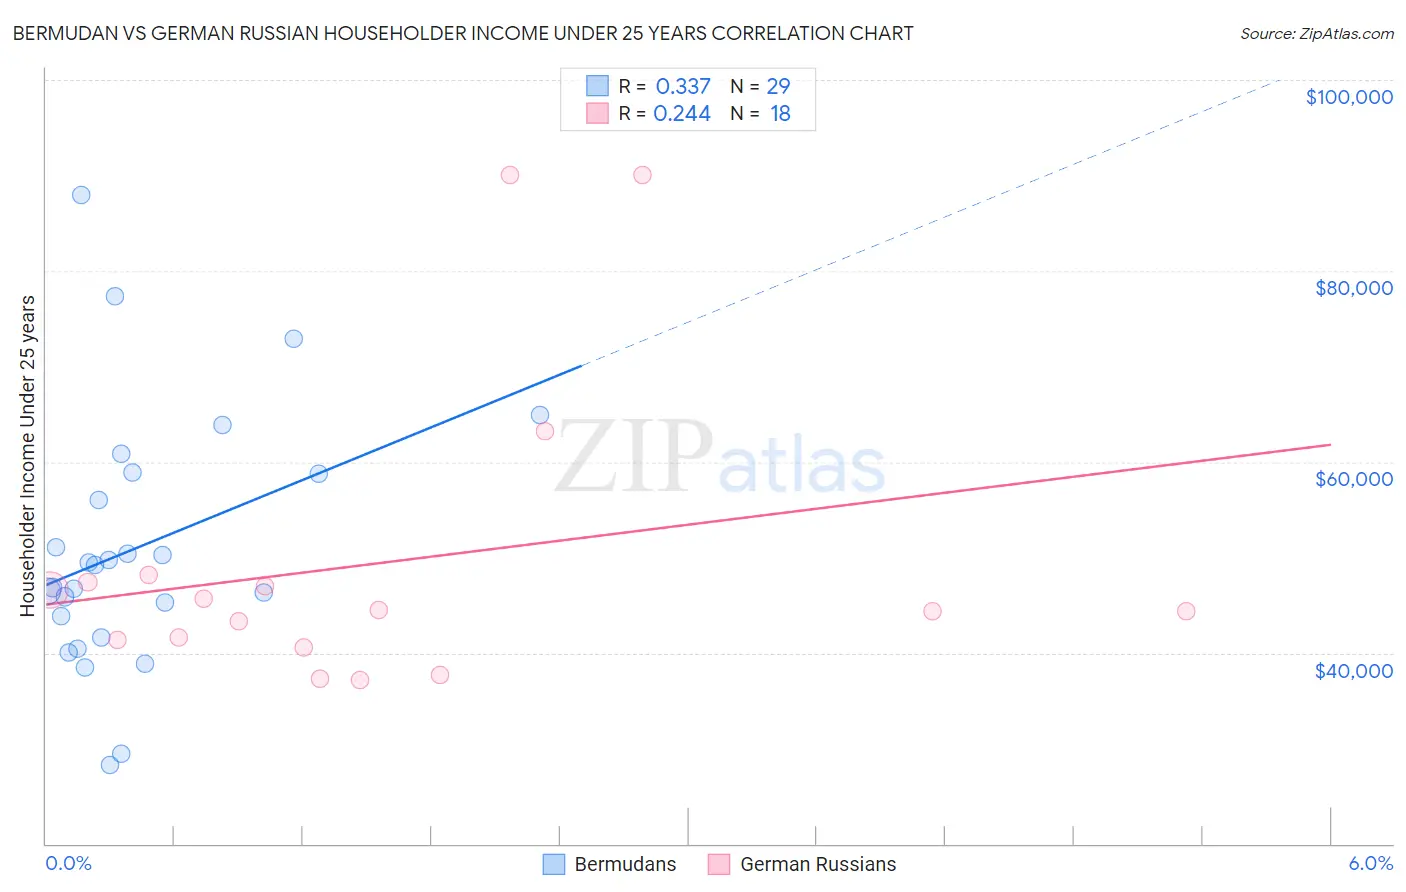
Bermudan vs German Russian Householder Income Under 25 years Correlation Chart
The statistical analysis conducted on geographies consisting of 52,946,816 people shows a mild positive correlation between the proportion of Bermudans and household income with householder under the age of 25 in the United States with a correlation coefficient (R) of 0.337 and weighted average of $47,359. Similarly, the statistical analysis conducted on geographies consisting of 91,630,953 people shows a weak positive correlation between the proportion of German Russians and household income with householder under the age of 25 in the United States with a correlation coefficient (R) of 0.244 and weighted average of $45,673, a difference of 3.7%.
Householder Income Under 25 years Correlation Summary
| Measurement | Bermudan | German Russian |
| Minimum | $28,306 | $37,121 |
| Maximum | $87,995 | $90,000 |
| Range | $59,689 | $52,879 |
| Mean | $51,037 | $49,457 |
| Median | $49,161 | $44,409 |
| Interquartile 25% (IQ1) | $42,763 | $41,330 |
| Interquartile 75% (IQ3) | $58,788 | $47,417 |
| Interquartile Range (IQR) | $16,024 | $6,088 |
| Standard Deviation (Sample) | $13,290 | $15,850 |
| Standard Deviation (Population) | $13,059 | $15,403 |
Demographics Similar to Bermudans and German Russians by Householder Income Under 25 years
In terms of householder income under 25 years, the demographic groups most similar to Bermudans are Ottawa ($47,366, a difference of 0.010%), Iroquois ($47,380, a difference of 0.040%), Delaware ($47,159, a difference of 0.43%), Chippewa ($47,015, a difference of 0.73%), and Crow ($47,012, a difference of 0.74%). Similarly, the demographic groups most similar to German Russians are Seminole ($45,649, a difference of 0.050%), Bahamian ($45,743, a difference of 0.15%), Osage ($45,764, a difference of 0.20%), Indonesian ($45,566, a difference of 0.23%), and Immigrants from Bahamas ($45,793, a difference of 0.26%).
| Demographics | Rating | Rank | Householder Income Under 25 years |
| Iroquois | 0.0 /100 | #310 | Tragic $47,380 |
| Ottawa | 0.0 /100 | #311 | Tragic $47,366 |
| Bermudans | 0.0 /100 | #312 | Tragic $47,359 |
| Delaware | 0.0 /100 | #313 | Tragic $47,159 |
| Chippewa | 0.0 /100 | #314 | Tragic $47,015 |
| Crow | 0.0 /100 | #315 | Tragic $47,012 |
| Sudanese | 0.0 /100 | #316 | Tragic $46,982 |
| Hopi | 0.0 /100 | #317 | Tragic $46,978 |
| Spanish Americans | 0.0 /100 | #318 | Tragic $46,913 |
| Africans | 0.0 /100 | #319 | Tragic $46,838 |
| Immigrants | Sudan | 0.0 /100 | #320 | Tragic $46,791 |
| Potawatomi | 0.0 /100 | #321 | Tragic $46,462 |
| Sioux | 0.0 /100 | #322 | Tragic $46,417 |
| Immigrants | Saudi Arabia | 0.0 /100 | #323 | Tragic $46,187 |
| Dutch West Indians | 0.0 /100 | #324 | Tragic $45,816 |
| Immigrants | Bahamas | 0.0 /100 | #325 | Tragic $45,793 |
| Osage | 0.0 /100 | #326 | Tragic $45,764 |
| Bahamians | 0.0 /100 | #327 | Tragic $45,743 |
| German Russians | 0.0 /100 | #328 | Tragic $45,673 |
| Seminole | 0.0 /100 | #329 | Tragic $45,649 |
| Indonesians | 0.0 /100 | #330 | Tragic $45,566 |