Immigrants from Latin America vs Immigrants from Indonesia Disability Age Under 5

COMPARE

Immigrants from Latin America
Race
Ancestry
AfghanAfricanAlaska NativeAlaskan AthabascanAlbanianAleutAlsatianAmericanApacheArabArapahoArgentineanArmenianAssyrian/Chaldean/SyriacAustralianAustrianBahamianBangladeshiBarbadianBasqueBelgianBelizeanBermudanBhutaneseBlackfeetBolivianBrazilianBritishBritish West IndianBulgarianBurmeseCajunCambodianCanadianCape VerdeanCarpatho RusynCelticCentral AmericanCentral American IndianCherokeeCheyenneChickasawChileanChineseChippewaChoctawColombianColvilleComancheCosta RicanCreeCreekCroatianCrowCubanCypriotCzechCzechoslovakianDanishDelawareDominicanDutchDutch West IndianEastern EuropeanEcuadorianEgyptianEnglishEstonianEthiopianEuropeanFijianFilipinoFinnishFrenchFrench American IndianFrench CanadianGermanGerman RussianGhanaianGreekGuamanian/ChamorroGuatemalanGuyaneseHaitianHmongHonduranHopiHoumaHungarianIcelanderIndian (Asian)IndonesianInupiatIranianIraqiIrishIroquoisIsraeliItalianJamaicanJapaneseJordanianKenyanKiowaKoreanLaotianLatvianLebaneseLiberianLithuanianLumbeeLuxembourgerMacedonianMalaysianMalteseMarshalleseMenomineeMexicanMexican American IndianMongolianMoroccanNative HawaiianNavajoNepaleseNew ZealanderNicaraguanNigerianNorthern EuropeanNorwegianOkinawanOsageOttawaPaiutePakistaniPalestinianPanamanianParaguayanPennsylvania GermanPeruvianPimaPolishPortuguesePotawatomiPuebloPuerto RicanPuget Sound SalishRomanianRussianSalvadoranSamoanScandinavianScotch-IrishScottishSeminoleSenegaleseSerbianShoshoneSierra LeoneanSiouxSlavicSlovakSloveneSomaliSouth AfricanSouth AmericanSouth American IndianSoviet UnionSpaniardSpanishSpanish AmericanSpanish American IndianSri LankanSubsaharan AfricanSudaneseSwedishSwissSyrianTaiwaneseThaiTlingit-HaidaTohono O'OdhamTonganTrinidadian and TobagonianTsimshianTurkishU.S. Virgin IslanderUgandanUkrainianUruguayanUteVenezuelanVietnameseWelshWest IndianYakamaYaquiYugoslavianYumanYup'ikZimbabwean
Immigration
NonimmigrantsImmigrantsAfghanistanAfricaAlbaniaArgentinaArmeniaAsiaAustraliaAustriaBahamasBangladeshBarbadosBelarusBelgiumBelizeBoliviaBosnia and HerzegovinaBrazilBulgariaBurma/MyanmarCabo VerdeCambodiaCameroonCanadaCaribbeanCentral AmericaChileChinaColombiaCongoCosta RicaCroatiaCubaCzechoslovakiaDenmarkDominicaDominican RepublicEastern AfricaEastern AsiaEastern EuropeEcuadorEgyptEl SalvadorEnglandEritreaEthiopiaEuropeFijiFranceGermanyGhanaGreeceGrenadaGuatemalaGuyanaHaitiHondurasHong KongHungaryIndiaIranIraqIrelandIsraelItalyJamaicaJapanJordanKazakhstanKenyaKoreaKuwaitLaosLatin AmericaLatviaLebanonLiberiaLithuaniaMalaysiaMexicoMicronesiaMiddle AfricaMoldovaMoroccoNepalNetherlandsNicaraguaNigeriaNorth AmericaNorth MacedoniaNorthern AfricaNorthern EuropeNorwayOceaniaPakistanPanamaPeruPhilippinesPolandPortugalRomaniaRussiaSaudi ArabiaScotlandSenegalSerbiaSierra LeoneSingaporeSomaliaSouth AfricaSouth AmericaSouth Central AsiaSouth Eastern AsiaSouthern EuropeSpainSri LankaSt. Vincent and the GrenadinesSudanSwedenSwitzerlandSyriaTaiwanThailandTrinidad and TobagoTurkeyUgandaUkraineUruguayUzbekistanVenezuelaVietnamWest IndiesWestern AfricaWestern AsiaWestern EuropeYemenZaireZimbabweAzores
Immigrants from Indonesia
Race
Ancestry
AfghanAfricanAlaska NativeAlaskan AthabascanAlbanianAleutAlsatianAmericanApacheArabArapahoArgentineanArmenianAssyrian/Chaldean/SyriacAustralianAustrianBahamianBangladeshiBarbadianBasqueBelgianBelizeanBermudanBhutaneseBlackfeetBolivianBrazilianBritishBritish West IndianBulgarianBurmeseCajunCambodianCanadianCape VerdeanCarpatho RusynCelticCentral AmericanCentral American IndianCherokeeCheyenneChickasawChileanChineseChippewaChoctawColombianColvilleComancheCosta RicanCreeCreekCroatianCrowCubanCypriotCzechCzechoslovakianDanishDelawareDominicanDutchDutch West IndianEastern EuropeanEcuadorianEgyptianEnglishEstonianEthiopianEuropeanFijianFilipinoFinnishFrenchFrench American IndianFrench CanadianGermanGerman RussianGhanaianGreekGuamanian/ChamorroGuatemalanGuyaneseHaitianHmongHonduranHopiHoumaHungarianIcelanderIndian (Asian)IndonesianInupiatIranianIraqiIrishIroquoisIsraeliItalianJamaicanJapaneseJordanianKenyanKiowaKoreanLaotianLatvianLebaneseLiberianLithuanianLumbeeLuxembourgerMacedonianMalaysianMalteseMarshalleseMenomineeMexicanMexican American IndianMongolianMoroccanNative HawaiianNavajoNepaleseNew ZealanderNicaraguanNigerianNorthern EuropeanNorwegianOkinawanOsageOttawaPaiutePakistaniPalestinianPanamanianParaguayanPennsylvania GermanPeruvianPimaPolishPortuguesePotawatomiPuebloPuerto RicanPuget Sound SalishRomanianRussianSalvadoranSamoanScandinavianScotch-IrishScottishSeminoleSenegaleseSerbianShoshoneSierra LeoneanSiouxSlavicSlovakSloveneSomaliSouth AfricanSouth AmericanSouth American IndianSoviet UnionSpaniardSpanishSpanish AmericanSpanish American IndianSri LankanSubsaharan AfricanSudaneseSwedishSwissSyrianTaiwaneseThaiTlingit-HaidaTohono O'OdhamTonganTrinidadian and TobagonianTsimshianTurkishU.S. Virgin IslanderUgandanUkrainianUruguayanUteVenezuelanVietnameseWelshWest IndianYakamaYaquiYugoslavianYumanYup'ikZimbabwean
Immigration
NonimmigrantsImmigrantsAfghanistanAfricaAlbaniaArgentinaArmeniaAsiaAustraliaAustriaBahamasBangladeshBarbadosBelarusBelgiumBelizeBoliviaBosnia and HerzegovinaBrazilBulgariaBurma/MyanmarCabo VerdeCambodiaCameroonCanadaCaribbeanCentral AmericaChileChinaColombiaCongoCosta RicaCroatiaCubaCzechoslovakiaDenmarkDominicaDominican RepublicEastern AfricaEastern AsiaEastern EuropeEcuadorEgyptEl SalvadorEnglandEritreaEthiopiaEuropeFijiFranceGermanyGhanaGreeceGrenadaGuatemalaGuyanaHaitiHondurasHong KongHungaryIndiaIndonesiaIranIraqIrelandIsraelItalyJamaicaJapanJordanKazakhstanKenyaKoreaKuwaitLaosLatviaLebanonLiberiaLithuaniaMalaysiaMexicoMicronesiaMiddle AfricaMoldovaMoroccoNepalNetherlandsNicaraguaNigeriaNorth AmericaNorth MacedoniaNorthern AfricaNorthern EuropeNorwayOceaniaPakistanPanamaPeruPhilippinesPolandPortugalRomaniaRussiaSaudi ArabiaScotlandSenegalSerbiaSierra LeoneSingaporeSomaliaSouth AfricaSouth AmericaSouth Central AsiaSouth Eastern AsiaSouthern EuropeSpainSri LankaSt. Vincent and the GrenadinesSudanSwedenSwitzerlandSyriaTaiwanThailandTrinidad and TobagoTurkeyUgandaUkraineUruguayUzbekistanVenezuelaVietnamWest IndiesWestern AfricaWestern AsiaWestern EuropeYemenZaireZimbabweAzores
Disability Age Under 5
Income
Poverty
Unemployment
Labor Participation
Family Structure
Vehicle Availability
Education Level
Disability

Disability Age Under 5 Comparison

Immigrants from Latin America

Immigrants from Indonesia

Good
Exceptional
1.2%
DISABILITY AGE UNDER 5
65.8/ 100
METRIC RATING
160th/ 347
METRIC RANK
1.1%
DISABILITY AGE UNDER 5
98.7/ 100
METRIC RATING
66th/ 347
METRIC RANK

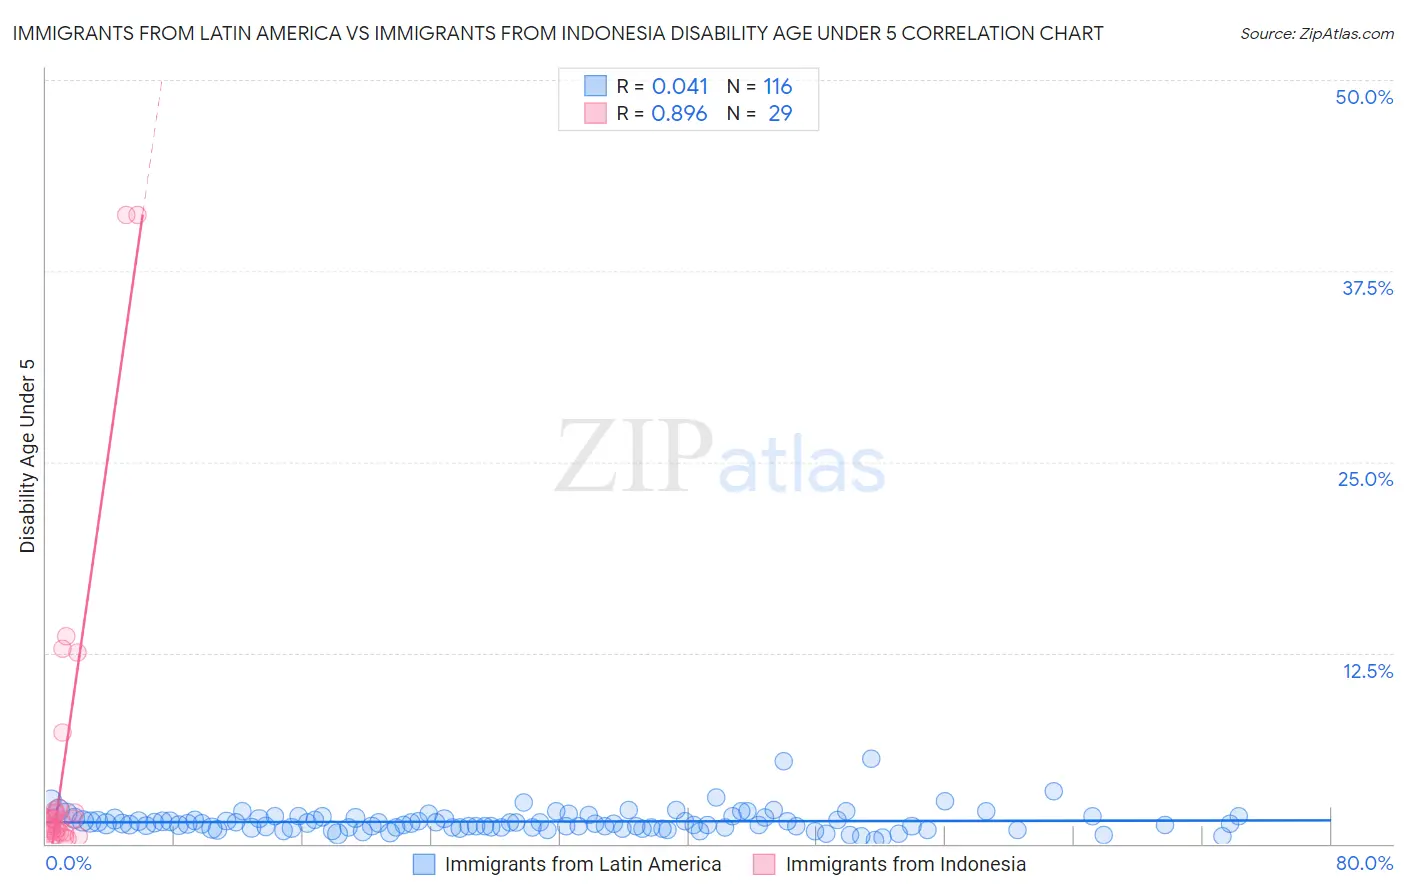
Immigrants from Latin America vs Immigrants from Indonesia Disability Age Under 5 Correlation Chart

The statistical analysis conducted on geographies consisting of 260,180,620 people shows no correlation between the proportion of Immigrants from Latin America and percentage of population with a disability under the age of 5 in the United States with a correlation coefficient (R) of 0.041 and weighted average of 1.2%. Similarly, the statistical analysis conducted on geographies consisting of 141,877,475 people shows a very strong positive correlation between the proportion of Immigrants from Indonesia and percentage of population with a disability under the age of 5 in the United States with a correlation coefficient (R) of 0.896 and weighted average of 1.1%, a difference of 9.3%.
Immigrants from Latin America vs Immigrants from Indonesia Disability Age Under 5

Disability Age Under 5 Correlation Summary

MeasurementImmigrants from Latin AmericaImmigrants from Indonesia
Minimum0.28%0.33%
Maximum5.6%41.2%
Range5.3%40.8%
Mean1.5%5.4%
Median1.3%1.5%
Interquartile 25% (IQ1)1.1%0.90%
Interquartile 75% (IQ3)1.7%2.3%
Interquartile Range (IQR)0.61%1.4%
Standard Deviation (Sample)0.76%10.6%
Standard Deviation (Population)0.76%10.4%

Similar Demographics by Disability Age Under 5

Demographics Similar to Immigrants from Latin America by Disability Age Under 5

In terms of disability age under 5, the demographic groups most similar to Immigrants from Latin America are Colombian (1.2%, a difference of 0.0%), Arab (1.2%, a difference of 0.060%), Immigrants from Africa (1.2%, a difference of 0.070%), Immigrants from South America (1.2%, a difference of 0.12%), and Guatemalan (1.2%, a difference of 0.22%).
DemographicsRating | RankDisability Age Under 5
Immigrants | Thailand
69.4
/100
|
#153
Good
1.2%
Uruguayans
68.8
/100
|
#154
Good
1.2%
Immigrants | Ghana
68.7
/100
|
#155
Good
1.2%
Hawaiians
68.5
/100
|
#156
Good
1.2%
Immigrants | South America
67.0
/100
|
#157
Good
1.2%
Arabs
66.4
/100
|
#158
Good
1.2%
Colombians
65.8
/100
|
#159
Good
1.2%
Immigrants | Latin America
65.8
/100
|
#160
Good
1.2%
Immigrants | Africa
65.1
/100
|
#161
Good
1.2%
Guatemalans
63.6
/100
|
#162
Good
1.2%
Immigrants | Guatemala
63.2
/100
|
#163
Good
1.2%
Laotians
62.8
/100
|
#164
Good
1.2%
Immigrants | Kuwait
62.6
/100
|
#165
Good
1.2%
Immigrants | Central America
61.4
/100
|
#166
Good
1.2%
Immigrants | Argentina
60.2
/100
|
#167
Good
1.2%

Demographics Similar to Immigrants from Indonesia by Disability Age Under 5

In terms of disability age under 5, the demographic groups most similar to Immigrants from Indonesia are Immigrants from Belize (1.1%, a difference of 0.070%), South African (1.1%, a difference of 0.10%), Immigrants from Korea (1.1%, a difference of 0.13%), Israeli (1.1%, a difference of 0.13%), and Immigrants from Ecuador (1.1%, a difference of 0.22%).
DemographicsRating | RankDisability Age Under 5
Immigrants | Malaysia
99.4
/100
|
#59
Exceptional
1.1%
Immigrants | Western Asia
99.2
/100
|
#60
Exceptional
1.1%
Immigrants | Ethiopia
99.2
/100
|
#61
Exceptional
1.1%
Immigrants | Switzerland
99.2
/100
|
#62
Exceptional
1.1%
Immigrants | Vietnam
99.1
/100
|
#63
Exceptional
1.1%
Egyptians
98.9
/100
|
#64
Exceptional
1.1%
Immigrants | Korea
98.8
/100
|
#65
Exceptional
1.1%
Immigrants | Indonesia
98.7
/100
|
#66
Exceptional
1.1%
Immigrants | Belize
98.7
/100
|
#67
Exceptional
1.1%
South Africans
98.7
/100
|
#68
Exceptional
1.1%
Israelis
98.7
/100
|
#69
Exceptional
1.1%
Immigrants | Ecuador
98.6
/100
|
#70
Exceptional
1.1%
Trinidadians and Tobagonians
98.6
/100
|
#71
Exceptional
1.1%
Burmese
98.5
/100
|
#72
Exceptional
1.1%
Immigrants | Sri Lanka
98.5
/100
|
#73
Exceptional
1.1%