Immigrants from Laos vs American In Labor Force | Age 45-54
COMPARE
Immigrants from Laos
American
In Labor Force | Age 45-54
In Labor Force | Age 45-54 Comparison
Immigrants from Laos
Americans
81.6%
IN LABOR FORCE | AGE 45-54
0.2/ 100
METRIC RATING
254th/ 347
METRIC RANK
80.4%
IN LABOR FORCE | AGE 45-54
0.0/ 100
METRIC RATING
297th/ 347
METRIC RANK
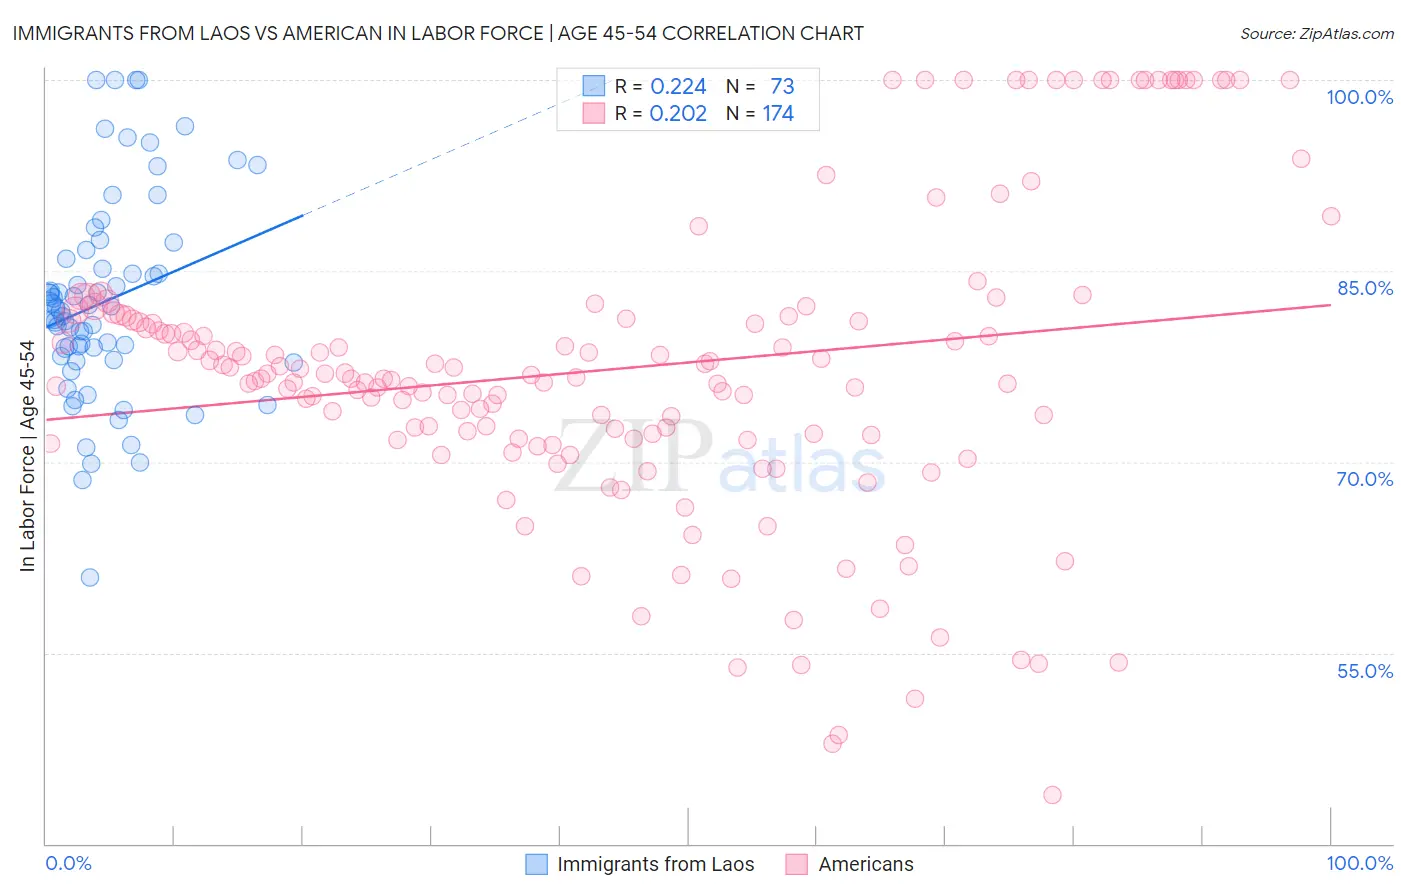
Immigrants from Laos vs American In Labor Force | Age 45-54 Correlation Chart
The statistical analysis conducted on geographies consisting of 201,465,424 people shows a weak positive correlation between the proportion of Immigrants from Laos and labor force participation rate among population between the ages 45 and 54 in the United States with a correlation coefficient (R) of 0.224 and weighted average of 81.6%. Similarly, the statistical analysis conducted on geographies consisting of 581,101,031 people shows a weak positive correlation between the proportion of Americans and labor force participation rate among population between the ages 45 and 54 in the United States with a correlation coefficient (R) of 0.202 and weighted average of 80.4%, a difference of 1.5%.
In Labor Force | Age 45-54 Correlation Summary
| Measurement | Immigrants from Laos | American |
| Minimum | 60.9% | 43.8% |
| Maximum | 100.0% | 100.0% |
| Range | 39.1% | 56.2% |
| Mean | 82.6% | 77.3% |
| Median | 81.9% | 76.6% |
| Interquartile 25% (IQ1) | 78.2% | 71.8% |
| Interquartile 75% (IQ3) | 86.3% | 81.3% |
| Interquartile Range (IQR) | 8.2% | 9.5% |
| Standard Deviation (Sample) | 8.0% | 11.8% |
| Standard Deviation (Population) | 7.9% | 11.8% |
Similar Demographics by In Labor Force | Age 45-54
Demographics Similar to Immigrants from Laos by In Labor Force | Age 45-54
In terms of in labor force | age 45-54, the demographic groups most similar to Immigrants from Laos are Japanese (81.6%, a difference of 0.010%), Scotch-Irish (81.6%, a difference of 0.020%), Pennsylvania German (81.6%, a difference of 0.030%), Barbadian (81.6%, a difference of 0.040%), and Guamanian/Chamorro (81.6%, a difference of 0.050%).
| Demographics | Rating | Rank | In Labor Force | Age 45-54 |
| Central Americans | 0.4 /100 | #247 | Tragic 81.7% |
| Puget Sound Salish | 0.3 /100 | #248 | Tragic 81.7% |
| Hmong | 0.3 /100 | #249 | Tragic 81.7% |
| Immigrants | Armenia | 0.2 /100 | #250 | Tragic 81.7% |
| Guamanians/Chamorros | 0.2 /100 | #251 | Tragic 81.6% |
| Pennsylvania Germans | 0.2 /100 | #252 | Tragic 81.6% |
| Japanese | 0.2 /100 | #253 | Tragic 81.6% |
| Immigrants | Laos | 0.2 /100 | #254 | Tragic 81.6% |
| Scotch-Irish | 0.2 /100 | #255 | Tragic 81.6% |
| Barbadians | 0.1 /100 | #256 | Tragic 81.6% |
| Immigrants | Congo | 0.1 /100 | #257 | Tragic 81.6% |
| Immigrants | Fiji | 0.1 /100 | #258 | Tragic 81.5% |
| Guyanese | 0.1 /100 | #259 | Tragic 81.5% |
| Spaniards | 0.1 /100 | #260 | Tragic 81.5% |
| Hawaiians | 0.1 /100 | #261 | Tragic 81.5% |
Demographics Similar to Americans by In Labor Force | Age 45-54
In terms of in labor force | age 45-54, the demographic groups most similar to Americans are Marshallese (80.3%, a difference of 0.040%), Dominican (80.3%, a difference of 0.15%), Fijian (80.2%, a difference of 0.15%), Spanish American Indian (80.2%, a difference of 0.17%), and African (80.5%, a difference of 0.18%).
| Demographics | Rating | Rank | In Labor Force | Age 45-54 |
| Mexican American Indians | 0.0 /100 | #290 | Tragic 80.7% |
| Immigrants | Belize | 0.0 /100 | #291 | Tragic 80.6% |
| Iroquois | 0.0 /100 | #292 | Tragic 80.6% |
| Osage | 0.0 /100 | #293 | Tragic 80.6% |
| Yakama | 0.0 /100 | #294 | Tragic 80.6% |
| Nepalese | 0.0 /100 | #295 | Tragic 80.5% |
| Africans | 0.0 /100 | #296 | Tragic 80.5% |
| Americans | 0.0 /100 | #297 | Tragic 80.4% |
| Marshallese | 0.0 /100 | #298 | Tragic 80.3% |
| Dominicans | 0.0 /100 | #299 | Tragic 80.3% |
| Fijians | 0.0 /100 | #300 | Tragic 80.2% |
| Spanish American Indians | 0.0 /100 | #301 | Tragic 80.2% |
| Immigrants | Central America | 0.0 /100 | #302 | Tragic 80.2% |
| Immigrants | Azores | 0.0 /100 | #303 | Tragic 80.1% |
| Hispanics or Latinos | 0.0 /100 | #304 | Tragic 80.1% |