Immigrants from Kazakhstan vs Nigerian Unemployment
COMPARE
Immigrants from Kazakhstan
Nigerian
Unemployment
Unemployment Comparison
Immigrants from Kazakhstan
Nigerians
5.2%
UNEMPLOYMENT
70.4/ 100
METRIC RATING
156th/ 347
METRIC RANK
5.8%
UNEMPLOYMENT
0.1/ 100
METRIC RATING
265th/ 347
METRIC RANK
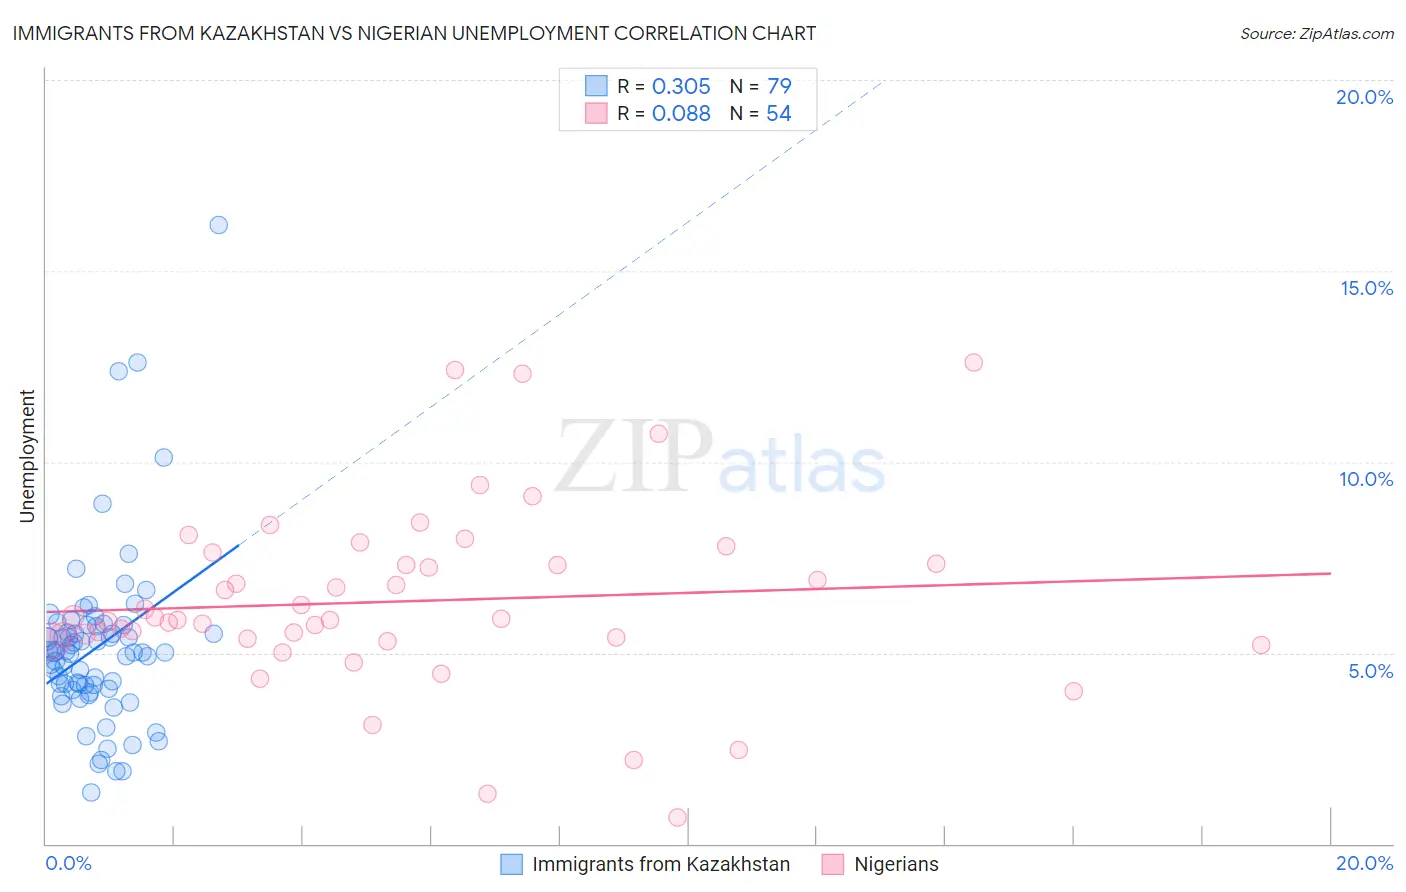
Immigrants from Kazakhstan vs Nigerian Unemployment Correlation Chart
The statistical analysis conducted on geographies consisting of 124,418,650 people shows a mild positive correlation between the proportion of Immigrants from Kazakhstan and unemployment in the United States with a correlation coefficient (R) of 0.305 and weighted average of 5.2%. Similarly, the statistical analysis conducted on geographies consisting of 332,601,343 people shows a slight positive correlation between the proportion of Nigerians and unemployment in the United States with a correlation coefficient (R) of 0.088 and weighted average of 5.8%, a difference of 12.0%.
Unemployment Correlation Summary
| Measurement | Immigrants from Kazakhstan | Nigerian |
| Minimum | 1.3% | 0.70% |
| Maximum | 16.2% | 12.6% |
| Range | 14.9% | 11.9% |
| Mean | 5.1% | 6.3% |
| Median | 5.0% | 5.9% |
| Interquartile 25% (IQ1) | 4.0% | 5.4% |
| Interquartile 75% (IQ3) | 5.7% | 7.3% |
| Interquartile Range (IQR) | 1.6% | 2.0% |
| Standard Deviation (Sample) | 2.3% | 2.4% |
| Standard Deviation (Population) | 2.3% | 2.4% |
Similar Demographics by Unemployment
Demographics Similar to Immigrants from Kazakhstan by Unemployment
In terms of unemployment, the demographic groups most similar to Immigrants from Kazakhstan are Sri Lankan (5.2%, a difference of 0.060%), Immigrants from Northern Africa (5.2%, a difference of 0.070%), Immigrants from Egypt (5.2%, a difference of 0.27%), Immigrants from Russia (5.2%, a difference of 0.27%), and Laotian (5.2%, a difference of 0.29%).
| Demographics | Rating | Rank | Unemployment |
| Syrians | 77.7 /100 | #149 | Good 5.2% |
| Potawatomi | 76.2 /100 | #150 | Good 5.2% |
| Immigrants | Eastern Europe | 75.3 /100 | #151 | Good 5.2% |
| Immigrants | Hong Kong | 75.2 /100 | #152 | Good 5.2% |
| Egyptians | 75.2 /100 | #153 | Good 5.2% |
| Immigrants | China | 74.7 /100 | #154 | Good 5.2% |
| Immigrants | Northern Africa | 71.3 /100 | #155 | Good 5.2% |
| Immigrants | Kazakhstan | 70.4 /100 | #156 | Good 5.2% |
| Sri Lankans | 69.5 /100 | #157 | Good 5.2% |
| Immigrants | Egypt | 66.7 /100 | #158 | Good 5.2% |
| Immigrants | Russia | 66.6 /100 | #159 | Good 5.2% |
| Laotians | 66.3 /100 | #160 | Good 5.2% |
| Immigrants | Oceania | 65.2 /100 | #161 | Good 5.2% |
| Spanish | 65.1 /100 | #162 | Good 5.2% |
| Immigrants | Zaire | 64.7 /100 | #163 | Good 5.2% |
Demographics Similar to Nigerians by Unemployment
In terms of unemployment, the demographic groups most similar to Nigerians are Immigrants from Liberia (5.8%, a difference of 0.070%), Salvadoran (5.8%, a difference of 0.16%), Sierra Leonean (5.8%, a difference of 0.19%), Immigrants from Guatemala (5.8%, a difference of 0.30%), and Immigrants from Uzbekistan (5.8%, a difference of 0.32%).
| Demographics | Rating | Rank | Unemployment |
| Immigrants | Bahamas | 0.1 /100 | #258 | Tragic 5.8% |
| Sub-Saharan Africans | 0.1 /100 | #259 | Tragic 5.8% |
| Immigrants | Uzbekistan | 0.1 /100 | #260 | Tragic 5.8% |
| Immigrants | Guatemala | 0.1 /100 | #261 | Tragic 5.8% |
| Sierra Leoneans | 0.1 /100 | #262 | Tragic 5.8% |
| Salvadorans | 0.1 /100 | #263 | Tragic 5.8% |
| Immigrants | Liberia | 0.1 /100 | #264 | Tragic 5.8% |
| Nigerians | 0.1 /100 | #265 | Tragic 5.8% |
| Mexican American Indians | 0.1 /100 | #266 | Tragic 5.8% |
| Immigrants | Nigeria | 0.1 /100 | #267 | Tragic 5.8% |
| Immigrants | Sierra Leone | 0.1 /100 | #268 | Tragic 5.8% |
| Immigrants | El Salvador | 0.1 /100 | #269 | Tragic 5.8% |
| Blackfeet | 0.1 /100 | #270 | Tragic 5.8% |
| Mexicans | 0.1 /100 | #271 | Tragic 5.9% |
| Hispanics or Latinos | 0.0 /100 | #272 | Tragic 5.9% |