Immigrants from Kazakhstan vs Immigrants from Germany Householder Income Ages 45 - 64 years
COMPARE
Immigrants from Kazakhstan
Immigrants from Germany
Householder Income Ages 45 - 64 years
Householder Income Ages 45 - 64 years Comparison
Immigrants from Kazakhstan
Immigrants from Germany
$107,378
HOUSEHOLDER INCOME AGES 45 - 64 YEARS
97.2/ 100
METRIC RATING
101st/ 347
METRIC RANK
$103,282
HOUSEHOLDER INCOME AGES 45 - 64 YEARS
81.5/ 100
METRIC RATING
148th/ 347
METRIC RANK
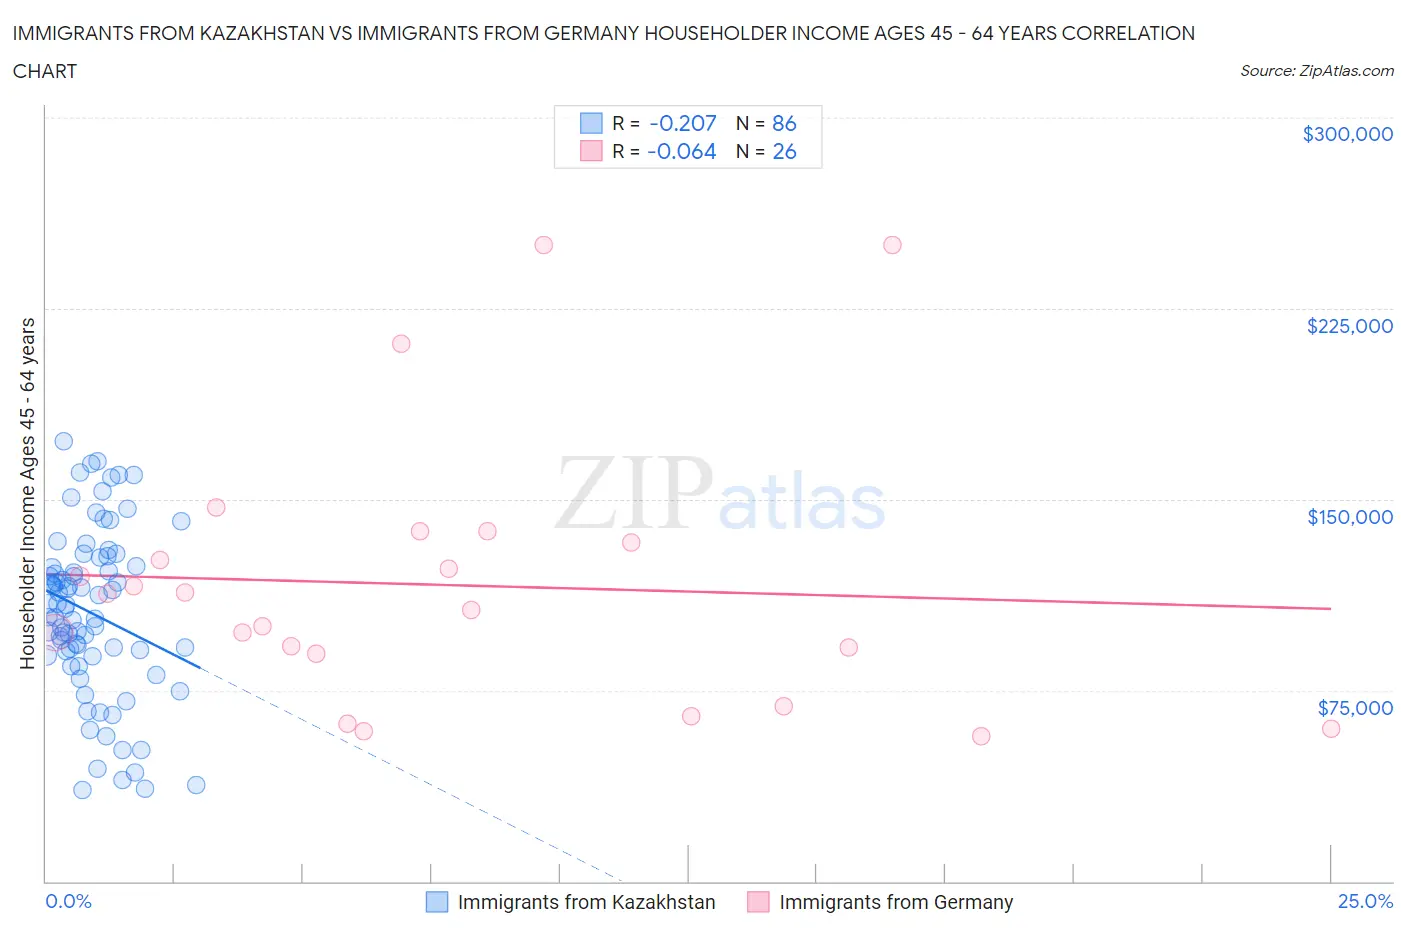
Immigrants from Kazakhstan vs Immigrants from Germany Householder Income Ages 45 - 64 years Correlation Chart
The statistical analysis conducted on geographies consisting of 124,401,740 people shows a weak negative correlation between the proportion of Immigrants from Kazakhstan and household income with householder between the ages 45 and 64 in the United States with a correlation coefficient (R) of -0.207 and weighted average of $107,378. Similarly, the statistical analysis conducted on geographies consisting of 463,046,856 people shows a slight negative correlation between the proportion of Immigrants from Germany and household income with householder between the ages 45 and 64 in the United States with a correlation coefficient (R) of -0.064 and weighted average of $103,282, a difference of 4.0%.
Householder Income Ages 45 - 64 years Correlation Summary
| Measurement | Immigrants from Kazakhstan | Immigrants from Germany |
| Minimum | $35,744 | $56,731 |
| Maximum | $172,765 | $250,001 |
| Range | $137,021 | $193,270 |
| Mean | $105,299 | $116,317 |
| Median | $107,663 | $109,777 |
| Interquartile 25% (IQ1) | $88,679 | $89,417 |
| Interquartile 75% (IQ3) | $123,884 | $133,088 |
| Interquartile Range (IQR) | $35,205 | $43,671 |
| Standard Deviation (Sample) | $32,729 | $52,104 |
| Standard Deviation (Population) | $32,539 | $51,092 |
Similar Demographics by Householder Income Ages 45 - 64 years
Demographics Similar to Immigrants from Kazakhstan by Householder Income Ages 45 - 64 years
In terms of householder income ages 45 - 64 years, the demographic groups most similar to Immigrants from Kazakhstan are Immigrants from Moldova ($107,357, a difference of 0.020%), Syrian ($107,207, a difference of 0.16%), Immigrants from Serbia ($107,569, a difference of 0.18%), Immigrants from Ukraine ($107,079, a difference of 0.28%), and Macedonian ($107,074, a difference of 0.28%).
| Demographics | Rating | Rank | Householder Income Ages 45 - 64 years |
| Sri Lankans | 98.2 /100 | #94 | Exceptional $108,270 |
| Immigrants | Hungary | 98.2 /100 | #95 | Exceptional $108,267 |
| Immigrants | Argentina | 98.2 /100 | #96 | Exceptional $108,264 |
| Northern Europeans | 97.8 /100 | #97 | Exceptional $107,870 |
| Immigrants | Southern Europe | 97.7 /100 | #98 | Exceptional $107,775 |
| Palestinians | 97.6 /100 | #99 | Exceptional $107,721 |
| Immigrants | Serbia | 97.4 /100 | #100 | Exceptional $107,569 |
| Immigrants | Kazakhstan | 97.2 /100 | #101 | Exceptional $107,378 |
| Immigrants | Moldova | 97.1 /100 | #102 | Exceptional $107,357 |
| Syrians | 96.9 /100 | #103 | Exceptional $107,207 |
| Immigrants | Ukraine | 96.7 /100 | #104 | Exceptional $107,079 |
| Macedonians | 96.7 /100 | #105 | Exceptional $107,074 |
| Armenians | 96.6 /100 | #106 | Exceptional $107,002 |
| Immigrants | Fiji | 96.5 /100 | #107 | Exceptional $106,952 |
| Zimbabweans | 96.3 /100 | #108 | Exceptional $106,849 |
Demographics Similar to Immigrants from Germany by Householder Income Ages 45 - 64 years
In terms of householder income ages 45 - 64 years, the demographic groups most similar to Immigrants from Germany are Immigrants from Sierra Leone ($103,227, a difference of 0.050%), Basque ($103,387, a difference of 0.10%), Immigrants from Peru ($103,173, a difference of 0.11%), Immigrants from Chile ($103,412, a difference of 0.13%), and Ugandan ($103,472, a difference of 0.18%).
| Demographics | Rating | Rank | Householder Income Ages 45 - 64 years |
| Immigrants | Uganda | 83.7 /100 | #141 | Excellent $103,584 |
| Luxembourgers | 83.3 /100 | #142 | Excellent $103,536 |
| Serbians | 83.2 /100 | #143 | Excellent $103,522 |
| Czechs | 83.1 /100 | #144 | Excellent $103,507 |
| Ugandans | 82.9 /100 | #145 | Excellent $103,472 |
| Immigrants | Chile | 82.5 /100 | #146 | Excellent $103,412 |
| Basques | 82.3 /100 | #147 | Excellent $103,387 |
| Immigrants | Germany | 81.5 /100 | #148 | Excellent $103,282 |
| Immigrants | Sierra Leone | 81.1 /100 | #149 | Excellent $103,227 |
| Immigrants | Peru | 80.7 /100 | #150 | Excellent $103,173 |
| Swiss | 79.9 /100 | #151 | Good $103,071 |
| Irish | 79.8 /100 | #152 | Good $103,067 |
| Scandinavians | 79.0 /100 | #153 | Good $102,969 |
| Slovenes | 78.3 /100 | #154 | Good $102,885 |
| Costa Ricans | 77.4 /100 | #155 | Good $102,779 |