Immigrants from Kazakhstan vs Immigrants from Germany Unemployment Among Ages 55 to 59 years
COMPARE
Immigrants from Kazakhstan
Immigrants from Germany
Unemployment Among Ages 55 to 59 years
Unemployment Among Ages 55 to 59 years Comparison
Immigrants from Kazakhstan
Immigrants from Germany
4.9%
UNEMPLOYMENT AMONG AGES 55 TO 59 YEARS
14.0/ 100
METRIC RATING
208th/ 347
METRIC RANK
4.7%
UNEMPLOYMENT AMONG AGES 55 TO 59 YEARS
94.8/ 100
METRIC RATING
98th/ 347
METRIC RANK
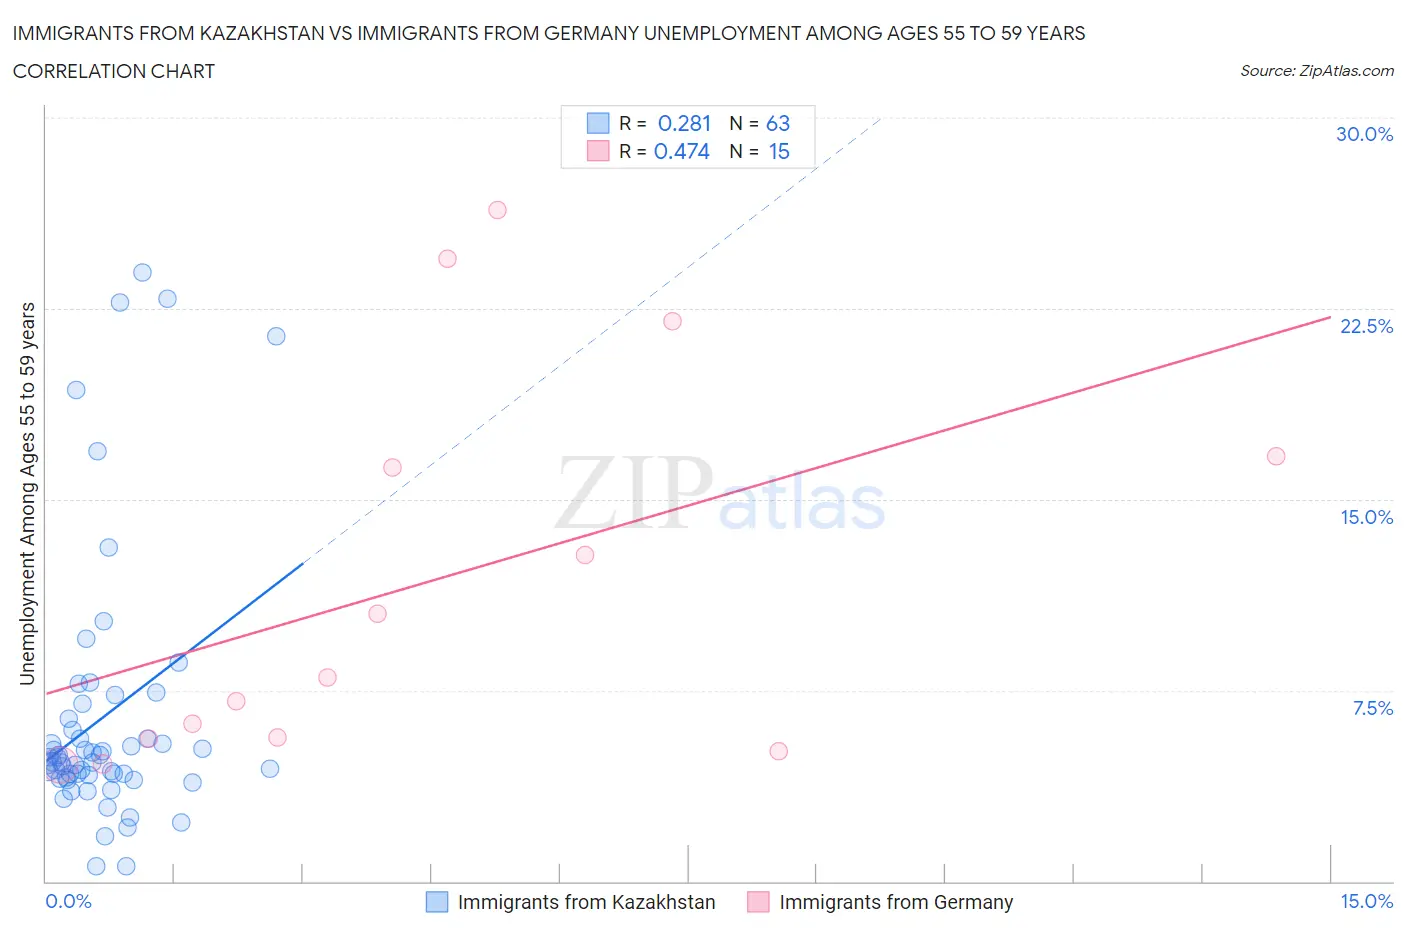
Immigrants from Kazakhstan vs Immigrants from Germany Unemployment Among Ages 55 to 59 years Correlation Chart
The statistical analysis conducted on geographies consisting of 121,588,823 people shows a weak positive correlation between the proportion of Immigrants from Kazakhstan and unemployment rate among population between the ages 55 and 59 in the United States with a correlation coefficient (R) of 0.281 and weighted average of 4.9%. Similarly, the statistical analysis conducted on geographies consisting of 421,964,428 people shows a moderate positive correlation between the proportion of Immigrants from Germany and unemployment rate among population between the ages 55 and 59 in the United States with a correlation coefficient (R) of 0.474 and weighted average of 4.7%, a difference of 5.0%.
Unemployment Among Ages 55 to 59 years Correlation Summary
| Measurement | Immigrants from Kazakhstan | Immigrants from Germany |
| Minimum | 0.60% | 4.6% |
| Maximum | 23.9% | 26.4% |
| Range | 23.3% | 21.8% |
| Mean | 6.5% | 11.7% |
| Median | 4.7% | 8.0% |
| Interquartile 25% (IQ1) | 4.1% | 5.6% |
| Interquartile 75% (IQ3) | 6.4% | 16.7% |
| Interquartile Range (IQR) | 2.3% | 11.1% |
| Standard Deviation (Sample) | 5.3% | 7.6% |
| Standard Deviation (Population) | 5.2% | 7.4% |
Similar Demographics by Unemployment Among Ages 55 to 59 years
Demographics Similar to Immigrants from Kazakhstan by Unemployment Among Ages 55 to 59 years
In terms of unemployment among ages 55 to 59 years, the demographic groups most similar to Immigrants from Kazakhstan are Immigrants from Belarus (4.9%, a difference of 0.010%), Immigrants from Australia (4.9%, a difference of 0.010%), Immigrants from Haiti (4.9%, a difference of 0.060%), Creek (4.9%, a difference of 0.090%), and Hawaiian (4.9%, a difference of 0.10%).
| Demographics | Rating | Rank | Unemployment Among Ages 55 to 59 years |
| Immigrants | South America | 23.1 /100 | #201 | Fair 4.9% |
| Lumbee | 22.5 /100 | #202 | Fair 4.9% |
| Guamanians/Chamorros | 20.8 /100 | #203 | Fair 4.9% |
| Immigrants | Latvia | 18.5 /100 | #204 | Poor 4.9% |
| Haitians | 18.1 /100 | #205 | Poor 4.9% |
| Immigrants | Belarus | 14.1 /100 | #206 | Poor 4.9% |
| Immigrants | Australia | 14.1 /100 | #207 | Poor 4.9% |
| Immigrants | Kazakhstan | 14.0 /100 | #208 | Poor 4.9% |
| Immigrants | Haiti | 13.3 /100 | #209 | Poor 4.9% |
| Creek | 12.9 /100 | #210 | Poor 4.9% |
| Hawaiians | 12.8 /100 | #211 | Poor 4.9% |
| Immigrants | Nonimmigrants | 11.2 /100 | #212 | Poor 4.9% |
| Bermudans | 11.0 /100 | #213 | Poor 4.9% |
| Immigrants | Denmark | 10.3 /100 | #214 | Poor 4.9% |
| Syrians | 8.6 /100 | #215 | Tragic 4.9% |
Demographics Similar to Immigrants from Germany by Unemployment Among Ages 55 to 59 years
In terms of unemployment among ages 55 to 59 years, the demographic groups most similar to Immigrants from Germany are Immigrants from Canada (4.7%, a difference of 0.010%), Yugoslavian (4.7%, a difference of 0.020%), Immigrants from Belgium (4.7%, a difference of 0.030%), Serbian (4.7%, a difference of 0.090%), and Celtic (4.7%, a difference of 0.11%).
| Demographics | Rating | Rank | Unemployment Among Ages 55 to 59 years |
| New Zealanders | 96.3 /100 | #91 | Exceptional 4.7% |
| Iraqis | 96.1 /100 | #92 | Exceptional 4.7% |
| Immigrants | England | 95.8 /100 | #93 | Exceptional 4.7% |
| Immigrants | Scotland | 95.7 /100 | #94 | Exceptional 4.7% |
| South Africans | 95.6 /100 | #95 | Exceptional 4.7% |
| Immigrants | Belgium | 95.0 /100 | #96 | Exceptional 4.7% |
| Immigrants | Canada | 94.9 /100 | #97 | Exceptional 4.7% |
| Immigrants | Germany | 94.8 /100 | #98 | Exceptional 4.7% |
| Yugoslavians | 94.7 /100 | #99 | Exceptional 4.7% |
| Serbians | 94.4 /100 | #100 | Exceptional 4.7% |
| Celtics | 94.3 /100 | #101 | Exceptional 4.7% |
| Canadians | 94.1 /100 | #102 | Exceptional 4.7% |
| Immigrants | Oceania | 94.0 /100 | #103 | Exceptional 4.7% |
| Immigrants | Turkey | 93.9 /100 | #104 | Exceptional 4.7% |
| Immigrants | North America | 93.9 /100 | #105 | Exceptional 4.7% |