Immigrants from Israel vs Immigrants from Zimbabwe Householder Income Ages 45 - 64 years
COMPARE
Immigrants from Israel
Immigrants from Zimbabwe
Householder Income Ages 45 - 64 years
Householder Income Ages 45 - 64 years Comparison
Immigrants from Israel
Immigrants from Zimbabwe
$122,893
HOUSEHOLDER INCOME AGES 45 - 64 YEARS
100.0/ 100
METRIC RATING
12th/ 347
METRIC RANK
$104,992
HOUSEHOLDER INCOME AGES 45 - 64 YEARS
91.2/ 100
METRIC RATING
130th/ 347
METRIC RANK
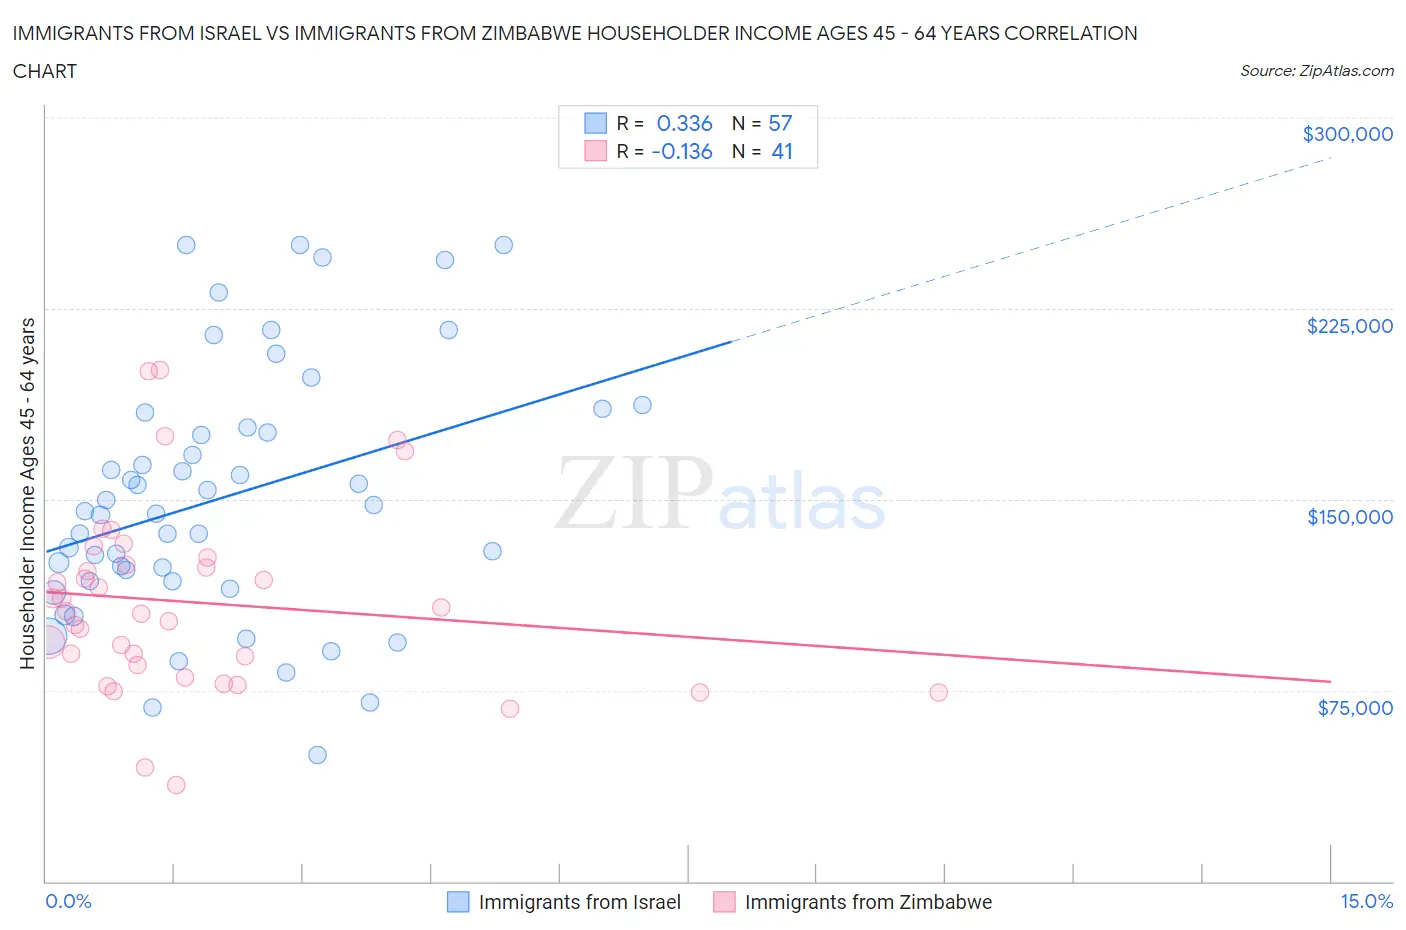
Immigrants from Israel vs Immigrants from Zimbabwe Householder Income Ages 45 - 64 years Correlation Chart
The statistical analysis conducted on geographies consisting of 209,875,627 people shows a mild positive correlation between the proportion of Immigrants from Israel and household income with householder between the ages 45 and 64 in the United States with a correlation coefficient (R) of 0.336 and weighted average of $122,893. Similarly, the statistical analysis conducted on geographies consisting of 117,765,117 people shows a poor negative correlation between the proportion of Immigrants from Zimbabwe and household income with householder between the ages 45 and 64 in the United States with a correlation coefficient (R) of -0.136 and weighted average of $104,992, a difference of 17.1%.
Householder Income Ages 45 - 64 years Correlation Summary
| Measurement | Immigrants from Israel | Immigrants from Zimbabwe |
| Minimum | $49,413 | $37,639 |
| Maximum | $250,001 | $200,729 |
| Range | $200,588 | $163,090 |
| Mean | $150,945 | $109,509 |
| Median | $145,254 | $106,206 |
| Interquartile 25% (IQ1) | $117,950 | $82,572 |
| Interquartile 75% (IQ3) | $181,200 | $125,652 |
| Interquartile Range (IQR) | $63,250 | $43,080 |
| Standard Deviation (Sample) | $49,727 | $36,656 |
| Standard Deviation (Population) | $49,289 | $36,206 |
Similar Demographics by Householder Income Ages 45 - 64 years
Demographics Similar to Immigrants from Israel by Householder Income Ages 45 - 64 years
In terms of householder income ages 45 - 64 years, the demographic groups most similar to Immigrants from Israel are Immigrants from Ireland ($122,757, a difference of 0.11%), Cypriot ($123,396, a difference of 0.41%), Indian (Asian) ($122,343, a difference of 0.45%), Immigrants from Eastern Asia ($122,222, a difference of 0.55%), and Immigrants from China ($122,178, a difference of 0.59%).
| Demographics | Rating | Rank | Householder Income Ages 45 - 64 years |
| Immigrants | Singapore | 100.0 /100 | #5 | Exceptional $129,514 |
| Iranians | 100.0 /100 | #6 | Exceptional $129,350 |
| Immigrants | Hong Kong | 100.0 /100 | #7 | Exceptional $127,500 |
| Immigrants | Iran | 100.0 /100 | #8 | Exceptional $126,940 |
| Okinawans | 100.0 /100 | #9 | Exceptional $124,796 |
| Immigrants | South Central Asia | 100.0 /100 | #10 | Exceptional $124,188 |
| Cypriots | 100.0 /100 | #11 | Exceptional $123,396 |
| Immigrants | Israel | 100.0 /100 | #12 | Exceptional $122,893 |
| Immigrants | Ireland | 100.0 /100 | #13 | Exceptional $122,757 |
| Indians (Asian) | 100.0 /100 | #14 | Exceptional $122,343 |
| Immigrants | Eastern Asia | 100.0 /100 | #15 | Exceptional $122,222 |
| Immigrants | China | 100.0 /100 | #16 | Exceptional $122,178 |
| Burmese | 100.0 /100 | #17 | Exceptional $121,444 |
| Immigrants | Korea | 100.0 /100 | #18 | Exceptional $121,243 |
| Eastern Europeans | 100.0 /100 | #19 | Exceptional $120,684 |
Demographics Similar to Immigrants from Zimbabwe by Householder Income Ages 45 - 64 years
In terms of householder income ages 45 - 64 years, the demographic groups most similar to Immigrants from Zimbabwe are Peruvian ($105,070, a difference of 0.070%), Immigrants from Syria ($104,858, a difference of 0.13%), Native Hawaiian ($105,149, a difference of 0.15%), Immigrants from Saudi Arabia ($105,249, a difference of 0.24%), and Lebanese ($104,734, a difference of 0.25%).
| Demographics | Rating | Rank | Householder Income Ages 45 - 64 years |
| Danes | 93.4 /100 | #123 | Exceptional $105,619 |
| Immigrants | Northern Africa | 92.8 /100 | #124 | Exceptional $105,430 |
| Pakistanis | 92.4 /100 | #125 | Exceptional $105,317 |
| Portuguese | 92.4 /100 | #126 | Exceptional $105,309 |
| Immigrants | Saudi Arabia | 92.2 /100 | #127 | Exceptional $105,249 |
| Native Hawaiians | 91.8 /100 | #128 | Exceptional $105,149 |
| Peruvians | 91.5 /100 | #129 | Exceptional $105,070 |
| Immigrants | Zimbabwe | 91.2 /100 | #130 | Exceptional $104,992 |
| Immigrants | Syria | 90.7 /100 | #131 | Exceptional $104,858 |
| Lebanese | 90.1 /100 | #132 | Exceptional $104,734 |
| Arabs | 89.3 /100 | #133 | Excellent $104,566 |
| Canadians | 89.3 /100 | #134 | Excellent $104,560 |
| Brazilians | 88.6 /100 | #135 | Excellent $104,408 |
| Taiwanese | 87.4 /100 | #136 | Excellent $104,180 |
| Hungarians | 85.8 /100 | #137 | Excellent $103,913 |