Immigrants from Iran vs Slovene Median Earnings
COMPARE
Immigrants from Iran
Slovene
Median Earnings
Median Earnings Comparison
Immigrants from Iran
Slovenes
$57,612
MEDIAN EARNINGS
100.0/ 100
METRIC RATING
8th/ 347
METRIC RANK
$47,995
MEDIAN EARNINGS
90.0/ 100
METRIC RATING
136th/ 347
METRIC RANK
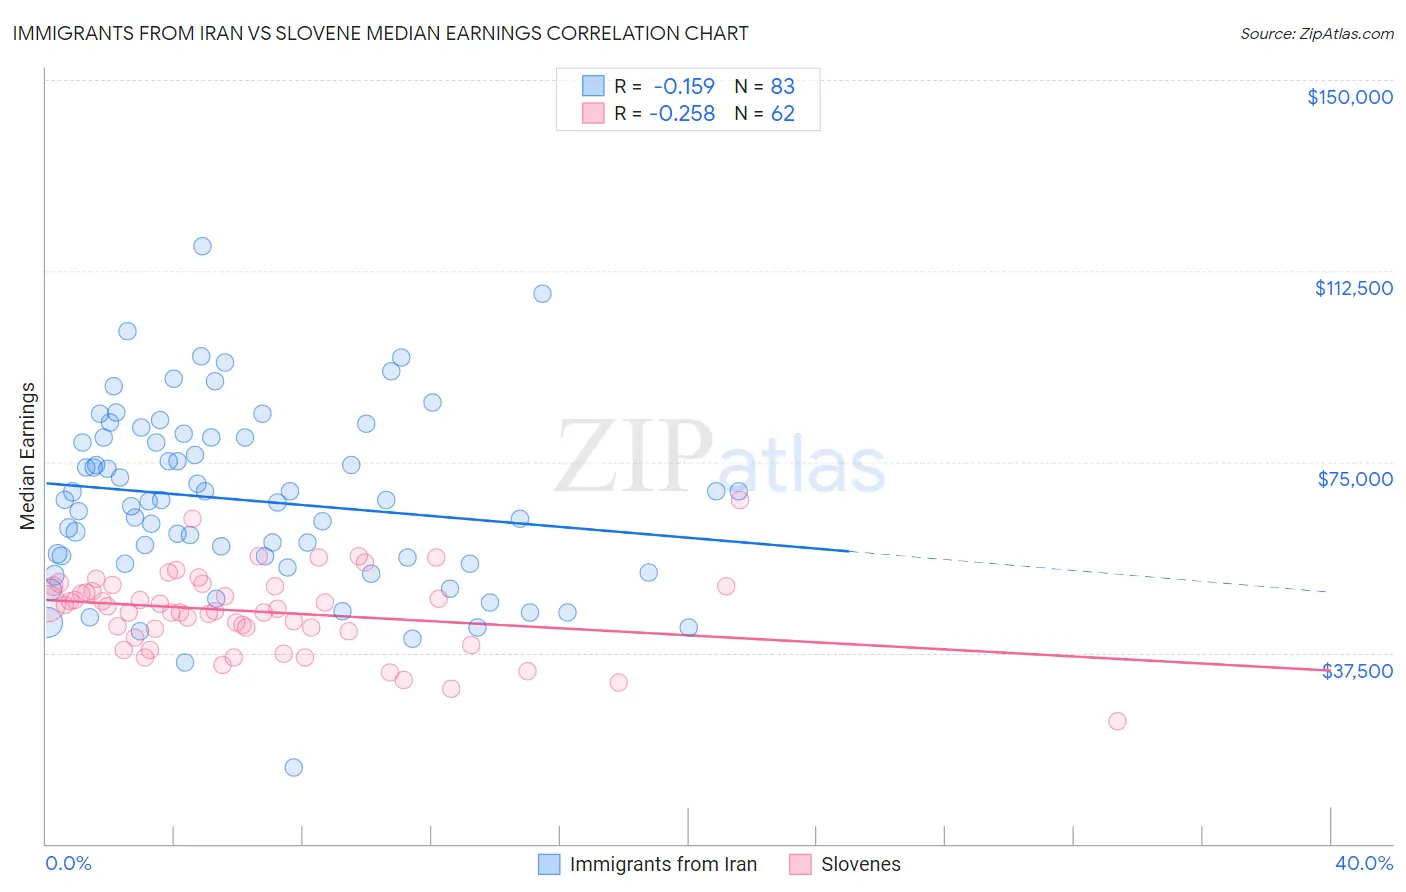
Immigrants from Iran vs Slovene Median Earnings Correlation Chart
The statistical analysis conducted on geographies consisting of 279,892,133 people shows a poor negative correlation between the proportion of Immigrants from Iran and median earnings in the United States with a correlation coefficient (R) of -0.159 and weighted average of $57,612. Similarly, the statistical analysis conducted on geographies consisting of 261,342,703 people shows a weak negative correlation between the proportion of Slovenes and median earnings in the United States with a correlation coefficient (R) of -0.258 and weighted average of $47,995, a difference of 20.0%.
Median Earnings Correlation Summary
| Measurement | Immigrants from Iran | Slovene |
| Minimum | $14,861 | $24,000 |
| Maximum | $117,429 | $67,559 |
| Range | $102,568 | $43,559 |
| Mean | $67,470 | $45,611 |
| Median | $67,500 | $46,389 |
| Interquartile 25% (IQ1) | $54,982 | $41,769 |
| Interquartile 75% (IQ3) | $79,813 | $50,577 |
| Interquartile Range (IQR) | $24,831 | $8,808 |
| Standard Deviation (Sample) | $17,753 | $7,962 |
| Standard Deviation (Population) | $17,645 | $7,897 |
Similar Demographics by Median Earnings
Demographics Similar to Immigrants from Iran by Median Earnings
In terms of median earnings, the demographic groups most similar to Immigrants from Iran are Okinawan ($57,550, a difference of 0.11%), Immigrants from South Central Asia ($57,114, a difference of 0.87%), Immigrants from Israel ($57,034, a difference of 1.0%), Immigrants from Ireland ($56,854, a difference of 1.3%), and Iranian ($58,474, a difference of 1.5%).
| Demographics | Rating | Rank | Median Earnings |
| Filipinos | 100.0 /100 | #1 | Exceptional $61,197 |
| Immigrants | Taiwan | 100.0 /100 | #2 | Exceptional $61,151 |
| Immigrants | India | 100.0 /100 | #3 | Exceptional $60,648 |
| Immigrants | Hong Kong | 100.0 /100 | #4 | Exceptional $59,433 |
| Thais | 100.0 /100 | #5 | Exceptional $59,237 |
| Immigrants | Singapore | 100.0 /100 | #6 | Exceptional $59,038 |
| Iranians | 100.0 /100 | #7 | Exceptional $58,474 |
| Immigrants | Iran | 100.0 /100 | #8 | Exceptional $57,612 |
| Okinawans | 100.0 /100 | #9 | Exceptional $57,550 |
| Immigrants | South Central Asia | 100.0 /100 | #10 | Exceptional $57,114 |
| Immigrants | Israel | 100.0 /100 | #11 | Exceptional $57,034 |
| Immigrants | Ireland | 100.0 /100 | #12 | Exceptional $56,854 |
| Immigrants | China | 100.0 /100 | #13 | Exceptional $56,638 |
| Immigrants | Australia | 100.0 /100 | #14 | Exceptional $56,305 |
| Indians (Asian) | 100.0 /100 | #15 | Exceptional $56,253 |
Demographics Similar to Slovenes by Median Earnings
In terms of median earnings, the demographic groups most similar to Slovenes are Portuguese ($48,032, a difference of 0.080%), Sri Lankan ($48,040, a difference of 0.090%), Immigrants from Uganda ($48,041, a difference of 0.10%), Immigrants from Nepal ($47,925, a difference of 0.15%), and European ($47,915, a difference of 0.17%).
| Demographics | Rating | Rank | Median Earnings |
| Pakistanis | 92.8 /100 | #129 | Exceptional $48,254 |
| Zimbabweans | 92.6 /100 | #130 | Exceptional $48,229 |
| Lebanese | 92.5 /100 | #131 | Exceptional $48,226 |
| British | 92.2 /100 | #132 | Exceptional $48,189 |
| Immigrants | Uganda | 90.5 /100 | #133 | Exceptional $48,041 |
| Sri Lankans | 90.5 /100 | #134 | Exceptional $48,040 |
| Portuguese | 90.4 /100 | #135 | Exceptional $48,032 |
| Slovenes | 90.0 /100 | #136 | Excellent $47,995 |
| Immigrants | Nepal | 89.0 /100 | #137 | Excellent $47,925 |
| Europeans | 88.9 /100 | #138 | Excellent $47,915 |
| Canadians | 88.8 /100 | #139 | Excellent $47,911 |
| Taiwanese | 88.7 /100 | #140 | Excellent $47,902 |
| Immigrants | Sierra Leone | 88.3 /100 | #141 | Excellent $47,875 |
| Ugandans | 88.0 /100 | #142 | Excellent $47,854 |
| Swedes | 88.0 /100 | #143 | Excellent $47,851 |