Immigrants from Iran vs Colville Single Father Households
COMPARE
Immigrants from Iran
Colville
Single Father Households
Single Father Households Comparison
Immigrants from Iran
Colville
1.9%
SINGLE FATHER HOUSEHOLDS
100.0/ 100
METRIC RATING
16th/ 347
METRIC RANK
3.3%
SINGLE FATHER HOUSEHOLDS
0.0/ 100
METRIC RATING
335th/ 347
METRIC RANK
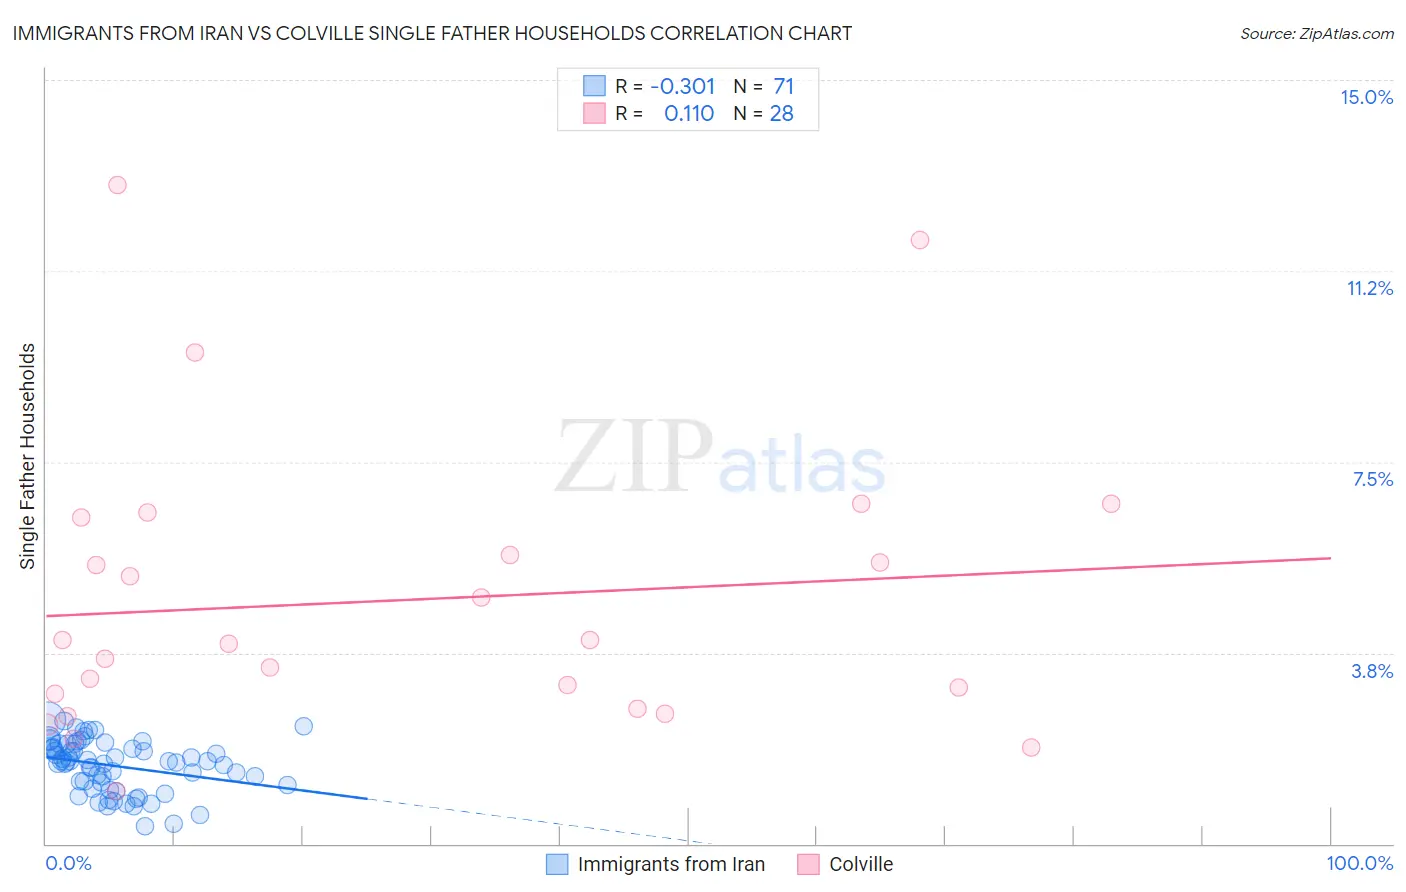
Immigrants from Iran vs Colville Single Father Households Correlation Chart
The statistical analysis conducted on geographies consisting of 278,578,987 people shows a mild negative correlation between the proportion of Immigrants from Iran and percentage of single father households in the United States with a correlation coefficient (R) of -0.301 and weighted average of 1.9%. Similarly, the statistical analysis conducted on geographies consisting of 34,617,249 people shows a poor positive correlation between the proportion of Colville and percentage of single father households in the United States with a correlation coefficient (R) of 0.110 and weighted average of 3.3%, a difference of 74.1%.
Single Father Households Correlation Summary
| Measurement | Immigrants from Iran | Colville |
| Minimum | 0.34% | 1.0% |
| Maximum | 2.4% | 12.9% |
| Range | 2.1% | 11.9% |
| Mean | 1.5% | 4.8% |
| Median | 1.6% | 4.0% |
| Interquartile 25% (IQ1) | 1.1% | 2.8% |
| Interquartile 75% (IQ3) | 1.9% | 6.0% |
| Interquartile Range (IQR) | 0.74% | 3.2% |
| Standard Deviation (Sample) | 0.50% | 2.9% |
| Standard Deviation (Population) | 0.50% | 2.8% |
Similar Demographics by Single Father Households
Demographics Similar to Immigrants from Iran by Single Father Households
In terms of single father households, the demographic groups most similar to Immigrants from Iran are Immigrants from Eastern Asia (1.9%, a difference of 0.20%), Immigrants from India (1.9%, a difference of 0.23%), Immigrants from Lithuania (1.9%, a difference of 0.35%), Indian (Asian) (1.9%, a difference of 0.72%), and Immigrants from Singapore (1.9%, a difference of 1.3%).
| Demographics | Rating | Rank | Single Father Households |
| Immigrants | China | 100.0 /100 | #9 | Exceptional 1.8% |
| Okinawans | 100.0 /100 | #10 | Exceptional 1.9% |
| Immigrants | Belarus | 100.0 /100 | #11 | Exceptional 1.9% |
| Immigrants | Greece | 100.0 /100 | #12 | Exceptional 1.9% |
| Immigrants | Singapore | 100.0 /100 | #13 | Exceptional 1.9% |
| Immigrants | Lithuania | 100.0 /100 | #14 | Exceptional 1.9% |
| Immigrants | Eastern Asia | 100.0 /100 | #15 | Exceptional 1.9% |
| Immigrants | Iran | 100.0 /100 | #16 | Exceptional 1.9% |
| Immigrants | India | 100.0 /100 | #17 | Exceptional 1.9% |
| Indians (Asian) | 100.0 /100 | #18 | Exceptional 1.9% |
| Iranians | 100.0 /100 | #19 | Exceptional 1.9% |
| Thais | 100.0 /100 | #20 | Exceptional 1.9% |
| Immigrants | Albania | 100.0 /100 | #21 | Exceptional 1.9% |
| Immigrants | Latvia | 100.0 /100 | #22 | Exceptional 1.9% |
| Immigrants | Croatia | 100.0 /100 | #23 | Exceptional 2.0% |
Demographics Similar to Colville by Single Father Households
In terms of single father households, the demographic groups most similar to Colville are Yuman (3.3%, a difference of 0.020%), Paiute (3.3%, a difference of 0.030%), Pueblo (3.3%, a difference of 0.28%), Sioux (3.3%, a difference of 0.96%), and Alaskan Athabascan (3.4%, a difference of 2.4%).
| Demographics | Rating | Rank | Single Father Households |
| Immigrants | Cabo Verde | 0.0 /100 | #328 | Tragic 3.1% |
| Chippewa | 0.0 /100 | #329 | Tragic 3.1% |
| Nepalese | 0.0 /100 | #330 | Tragic 3.1% |
| Navajo | 0.0 /100 | #331 | Tragic 3.2% |
| Yaqui | 0.0 /100 | #332 | Tragic 3.2% |
| Natives/Alaskans | 0.0 /100 | #333 | Tragic 3.2% |
| Yuman | 0.0 /100 | #334 | Tragic 3.3% |
| Colville | 0.0 /100 | #335 | Tragic 3.3% |
| Paiute | 0.0 /100 | #336 | Tragic 3.3% |
| Pueblo | 0.0 /100 | #337 | Tragic 3.3% |
| Sioux | 0.0 /100 | #338 | Tragic 3.3% |
| Alaskan Athabascans | 0.0 /100 | #339 | Tragic 3.4% |
| Alaska Natives | 0.0 /100 | #340 | Tragic 3.5% |
| Crow | 0.0 /100 | #341 | Tragic 3.5% |
| Tohono O'odham | 0.0 /100 | #342 | Tragic 3.8% |