Cree vs Immigrants from Morocco Householder Income Ages 25 - 44 years
COMPARE
Cree
Immigrants from Morocco
Householder Income Ages 25 - 44 years
Householder Income Ages 25 - 44 years Comparison
Cree
Immigrants from Morocco
$84,574
HOUSEHOLDER INCOME AGES 25 - 44 YEARS
0.4/ 100
METRIC RATING
262nd/ 347
METRIC RANK
$97,305
HOUSEHOLDER INCOME AGES 25 - 44 YEARS
82.0/ 100
METRIC RATING
140th/ 347
METRIC RANK
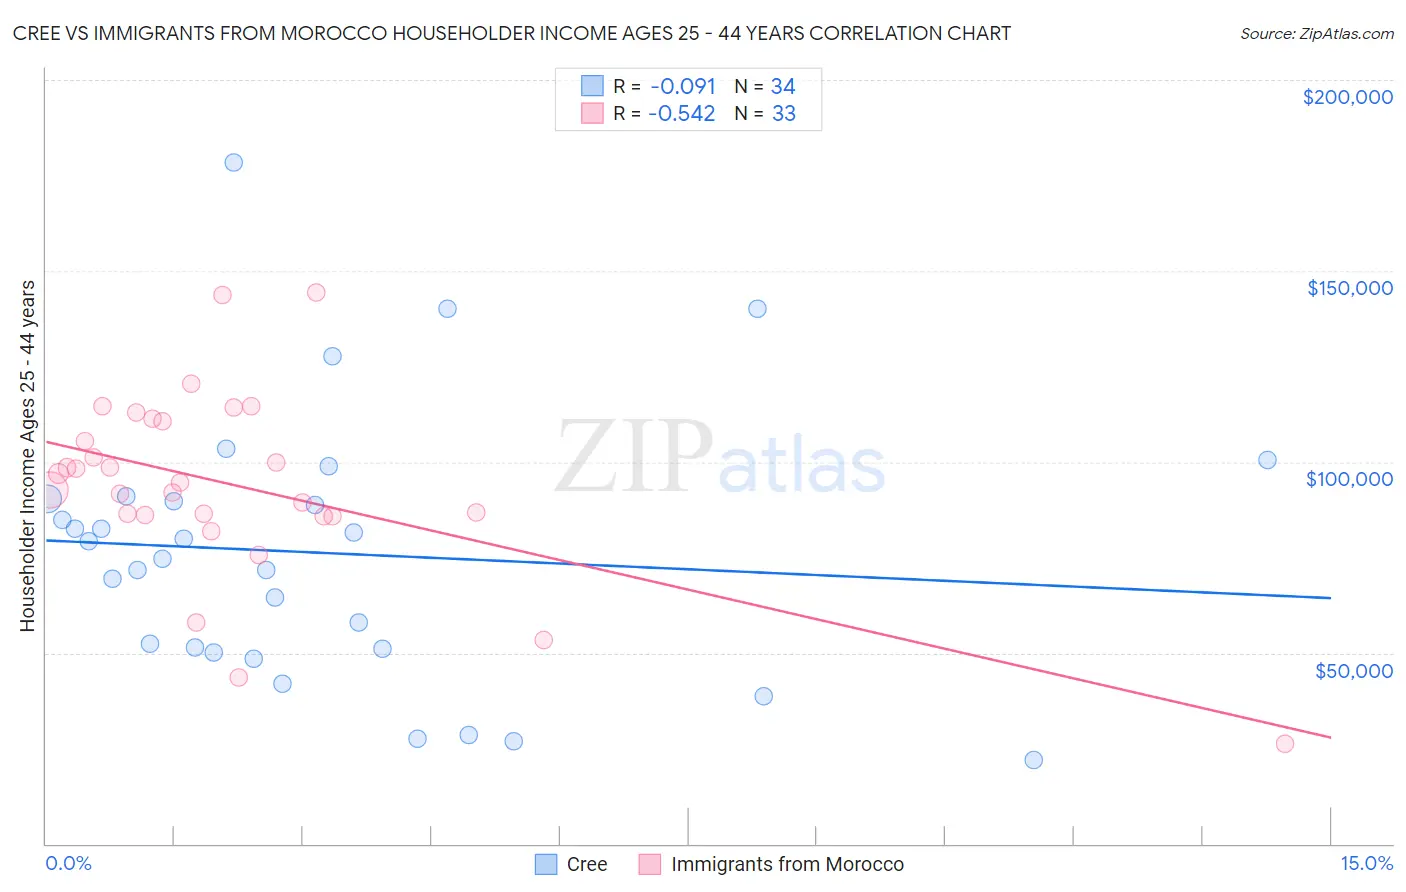
Cree vs Immigrants from Morocco Householder Income Ages 25 - 44 years Correlation Chart
The statistical analysis conducted on geographies consisting of 76,153,555 people shows a slight negative correlation between the proportion of Cree and household income with householder between the ages 25 and 44 in the United States with a correlation coefficient (R) of -0.091 and weighted average of $84,574. Similarly, the statistical analysis conducted on geographies consisting of 178,797,729 people shows a substantial negative correlation between the proportion of Immigrants from Morocco and household income with householder between the ages 25 and 44 in the United States with a correlation coefficient (R) of -0.542 and weighted average of $97,305, a difference of 15.0%.
Householder Income Ages 25 - 44 years Correlation Summary
| Measurement | Cree | Immigrants from Morocco |
| Minimum | $22,083 | $26,250 |
| Maximum | $178,304 | $144,345 |
| Range | $156,221 | $118,095 |
| Mean | $76,111 | $93,983 |
| Median | $76,790 | $94,739 |
| Interquartile 25% (IQ1) | $50,987 | $85,878 |
| Interquartile 75% (IQ3) | $90,298 | $111,008 |
| Interquartile Range (IQR) | $39,311 | $25,131 |
| Standard Deviation (Sample) | $35,026 | $24,483 |
| Standard Deviation (Population) | $34,507 | $24,109 |
Similar Demographics by Householder Income Ages 25 - 44 years
Demographics Similar to Cree by Householder Income Ages 25 - 44 years
In terms of householder income ages 25 - 44 years, the demographic groups most similar to Cree are Inupiat ($84,619, a difference of 0.050%), Belizean ($84,534, a difference of 0.050%), Osage ($84,461, a difference of 0.13%), Sudanese ($84,401, a difference of 0.20%), and American ($84,791, a difference of 0.26%).
| Demographics | Rating | Rank | Householder Income Ages 25 - 44 years |
| German Russians | 0.6 /100 | #255 | Tragic $85,220 |
| Central Americans | 0.5 /100 | #256 | Tragic $85,144 |
| Mexican American Indians | 0.5 /100 | #257 | Tragic $85,066 |
| Immigrants | Nicaragua | 0.5 /100 | #258 | Tragic $84,914 |
| Immigrants | Senegal | 0.5 /100 | #259 | Tragic $84,848 |
| Americans | 0.4 /100 | #260 | Tragic $84,791 |
| Inupiat | 0.4 /100 | #261 | Tragic $84,619 |
| Cree | 0.4 /100 | #262 | Tragic $84,574 |
| Belizeans | 0.4 /100 | #263 | Tragic $84,534 |
| Osage | 0.4 /100 | #264 | Tragic $84,461 |
| Sudanese | 0.4 /100 | #265 | Tragic $84,401 |
| Immigrants | Cabo Verde | 0.3 /100 | #266 | Tragic $84,304 |
| Hmong | 0.3 /100 | #267 | Tragic $84,258 |
| Sub-Saharan Africans | 0.3 /100 | #268 | Tragic $84,235 |
| Spanish American Indians | 0.3 /100 | #269 | Tragic $84,085 |
Demographics Similar to Immigrants from Morocco by Householder Income Ages 25 - 44 years
In terms of householder income ages 25 - 44 years, the demographic groups most similar to Immigrants from Morocco are Immigrants from Peru ($97,329, a difference of 0.020%), Lebanese ($97,339, a difference of 0.030%), Arab ($97,336, a difference of 0.030%), Luxembourger ($97,237, a difference of 0.070%), and Danish ($97,221, a difference of 0.090%).
| Demographics | Rating | Rank | Householder Income Ages 25 - 44 years |
| Tsimshian | 85.8 /100 | #133 | Excellent $97,809 |
| Canadians | 84.5 /100 | #134 | Excellent $97,625 |
| Immigrants | Oceania | 84.5 /100 | #135 | Excellent $97,623 |
| Hungarians | 83.9 /100 | #136 | Excellent $97,544 |
| Lebanese | 82.3 /100 | #137 | Excellent $97,339 |
| Arabs | 82.3 /100 | #138 | Excellent $97,336 |
| Immigrants | Peru | 82.2 /100 | #139 | Excellent $97,329 |
| Immigrants | Morocco | 82.0 /100 | #140 | Excellent $97,305 |
| Luxembourgers | 81.5 /100 | #141 | Excellent $97,237 |
| Danes | 81.3 /100 | #142 | Excellent $97,221 |
| Immigrants | Jordan | 81.0 /100 | #143 | Excellent $97,185 |
| Immigrants | Chile | 80.8 /100 | #144 | Excellent $97,159 |
| Norwegians | 78.2 /100 | #145 | Good $96,866 |
| Ethiopians | 77.8 /100 | #146 | Good $96,824 |
| Immigrants | Syria | 77.4 /100 | #147 | Good $96,789 |