Native Hawaiian vs Immigrants from Belarus Householder Income Under 25 years
COMPARE
Native Hawaiian
Immigrants from Belarus
Householder Income Under 25 years
Householder Income Under 25 years Comparison
Native Hawaiians
Immigrants from Belarus
$55,158
HOUSEHOLDER INCOME UNDER 25 YEARS
99.9/ 100
METRIC RATING
59th/ 347
METRIC RANK
$55,743
HOUSEHOLDER INCOME UNDER 25 YEARS
100.0/ 100
METRIC RATING
39th/ 347
METRIC RANK
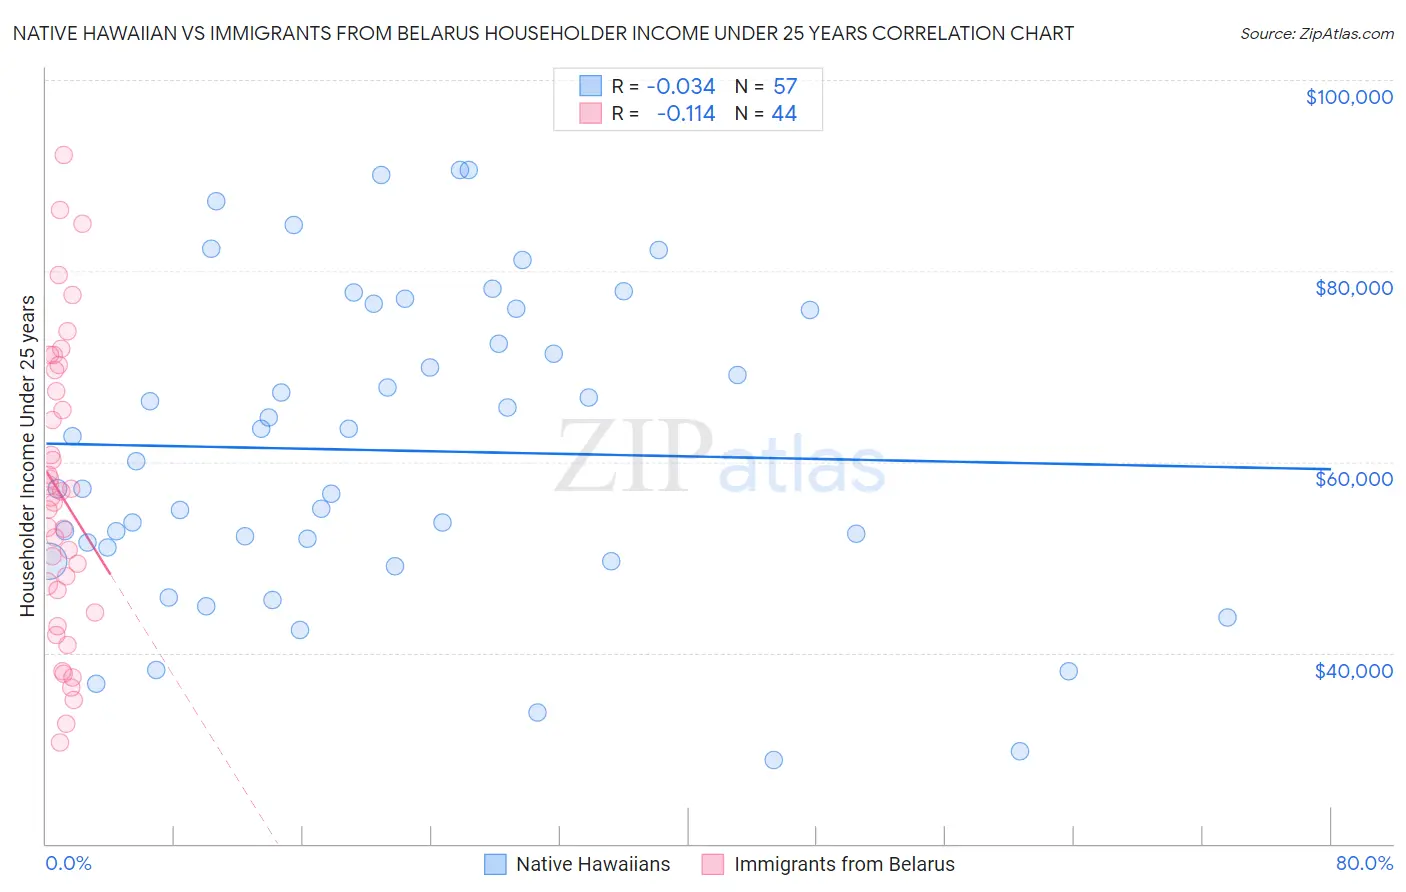
Native Hawaiian vs Immigrants from Belarus Householder Income Under 25 years Correlation Chart
The statistical analysis conducted on geographies consisting of 291,294,461 people shows no correlation between the proportion of Native Hawaiians and household income with householder under the age of 25 in the United States with a correlation coefficient (R) of -0.034 and weighted average of $55,158. Similarly, the statistical analysis conducted on geographies consisting of 133,690,397 people shows a poor negative correlation between the proportion of Immigrants from Belarus and household income with householder under the age of 25 in the United States with a correlation coefficient (R) of -0.114 and weighted average of $55,743, a difference of 1.1%.
Householder Income Under 25 years Correlation Summary
| Measurement | Native Hawaiian | Immigrants from Belarus |
| Minimum | $28,780 | $30,579 |
| Maximum | $90,625 | $92,155 |
| Range | $61,845 | $61,576 |
| Mean | $61,198 | $56,592 |
| Median | $60,033 | $56,002 |
| Interquartile 25% (IQ1) | $50,290 | $45,431 |
| Interquartile 75% (IQ3) | $75,972 | $68,480 |
| Interquartile Range (IQR) | $25,682 | $23,049 |
| Standard Deviation (Sample) | $16,094 | $15,215 |
| Standard Deviation (Population) | $15,952 | $15,041 |
Demographics Similar to Native Hawaiians and Immigrants from Belarus by Householder Income Under 25 years
In terms of householder income under 25 years, the demographic groups most similar to Native Hawaiians are Guyanese ($55,210, a difference of 0.090%), Soviet Union ($55,340, a difference of 0.33%), Salvadoran ($55,412, a difference of 0.46%), Immigrants from Ukraine ($55,447, a difference of 0.52%), and Immigrants from Poland ($55,474, a difference of 0.57%). Similarly, the demographic groups most similar to Immigrants from Belarus are Immigrants from Greece ($55,727, a difference of 0.030%), Immigrants from Guyana ($55,726, a difference of 0.030%), Immigrants from Korea ($55,716, a difference of 0.050%), Immigrants from South Eastern Asia ($55,714, a difference of 0.050%), and Paraguayan ($55,614, a difference of 0.23%).
| Demographics | Rating | Rank | Householder Income Under 25 years |
| Immigrants | Belarus | 100.0 /100 | #39 | Exceptional $55,743 |
| Immigrants | Greece | 100.0 /100 | #40 | Exceptional $55,727 |
| Immigrants | Guyana | 100.0 /100 | #41 | Exceptional $55,726 |
| Immigrants | Korea | 100.0 /100 | #42 | Exceptional $55,716 |
| Immigrants | South Eastern Asia | 100.0 /100 | #43 | Exceptional $55,714 |
| Paraguayans | 100.0 /100 | #44 | Exceptional $55,614 |
| Spanish American Indians | 100.0 /100 | #45 | Exceptional $55,573 |
| Immigrants | Eastern Europe | 100.0 /100 | #46 | Exceptional $55,572 |
| Cambodians | 100.0 /100 | #47 | Exceptional $55,571 |
| Immigrants | Vietnam | 100.0 /100 | #48 | Exceptional $55,562 |
| Iranians | 100.0 /100 | #49 | Exceptional $55,548 |
| Puget Sound Salish | 100.0 /100 | #50 | Exceptional $55,543 |
| Immigrants | Romania | 100.0 /100 | #51 | Exceptional $55,522 |
| Immigrants | Indonesia | 100.0 /100 | #52 | Exceptional $55,521 |
| Immigrants | Poland | 100.0 /100 | #53 | Exceptional $55,474 |
| Sri Lankans | 100.0 /100 | #54 | Exceptional $55,470 |
| Immigrants | Ukraine | 100.0 /100 | #55 | Exceptional $55,447 |
| Salvadorans | 100.0 /100 | #56 | Exceptional $55,412 |
| Soviet Union | 100.0 /100 | #57 | Exceptional $55,340 |
| Guyanese | 99.9 /100 | #58 | Exceptional $55,210 |
| Native Hawaiians | 99.9 /100 | #59 | Exceptional $55,158 |