Immigrants from Guyana vs Bahamian Householder Income Ages 25 - 44 years
COMPARE
Immigrants from Guyana
Bahamian
Householder Income Ages 25 - 44 years
Householder Income Ages 25 - 44 years Comparison
Immigrants from Guyana
Bahamians
$89,586
HOUSEHOLDER INCOME AGES 25 - 44 YEARS
5.9/ 100
METRIC RATING
223rd/ 347
METRIC RANK
$75,395
HOUSEHOLDER INCOME AGES 25 - 44 YEARS
0.0/ 100
METRIC RATING
332nd/ 347
METRIC RANK
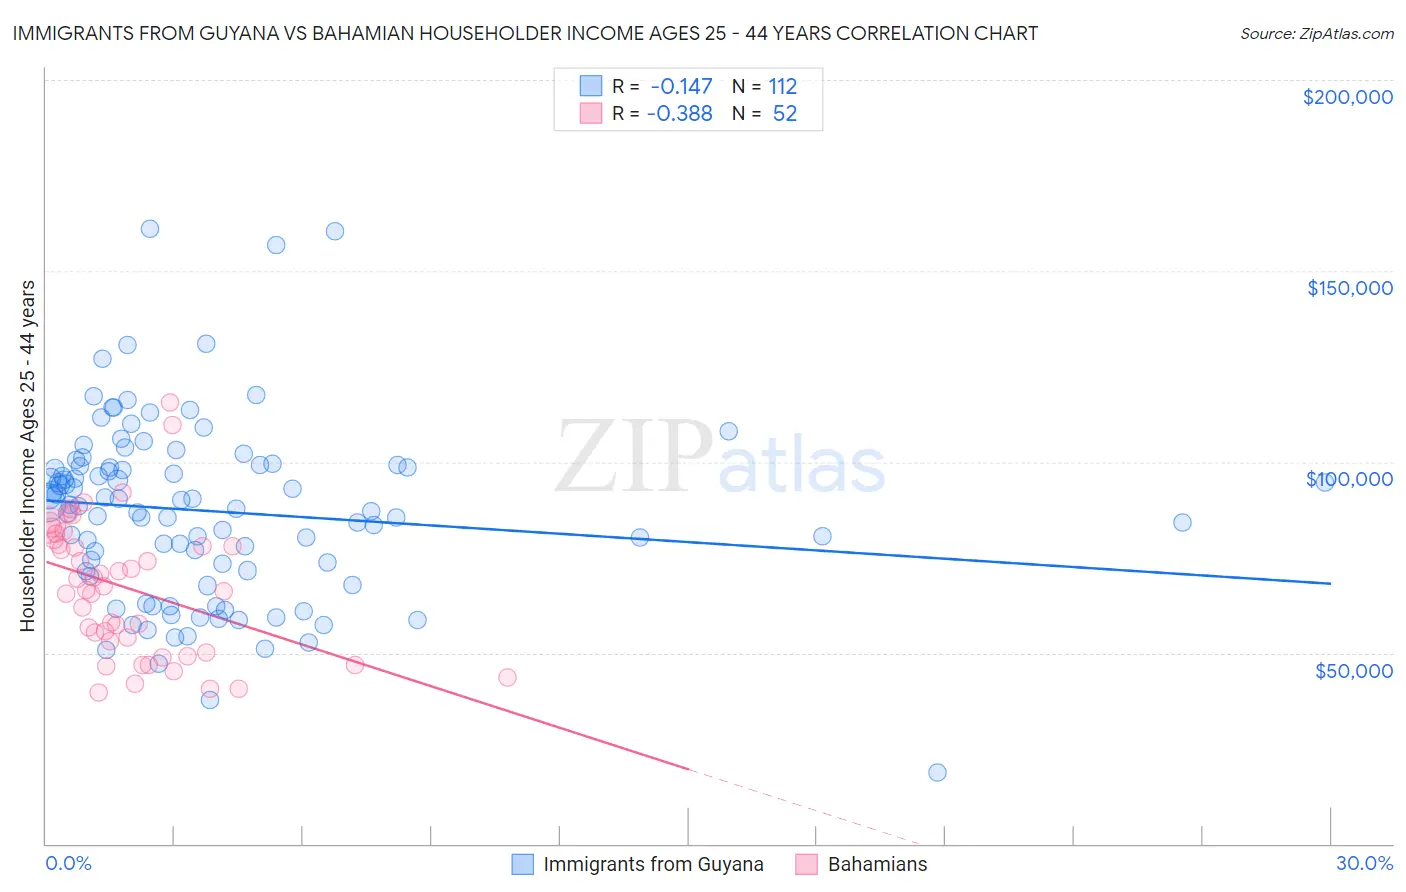
Immigrants from Guyana vs Bahamian Householder Income Ages 25 - 44 years Correlation Chart
The statistical analysis conducted on geographies consisting of 183,521,804 people shows a poor negative correlation between the proportion of Immigrants from Guyana and household income with householder between the ages 25 and 44 in the United States with a correlation coefficient (R) of -0.147 and weighted average of $89,586. Similarly, the statistical analysis conducted on geographies consisting of 112,379,303 people shows a mild negative correlation between the proportion of Bahamians and household income with householder between the ages 25 and 44 in the United States with a correlation coefficient (R) of -0.388 and weighted average of $75,395, a difference of 18.8%.
Householder Income Ages 25 - 44 years Correlation Summary
| Measurement | Immigrants from Guyana | Bahamian |
| Minimum | $18,657 | $39,485 |
| Maximum | $161,089 | $115,565 |
| Range | $142,432 | $76,080 |
| Mean | $87,058 | $66,851 |
| Median | $88,583 | $66,950 |
| Interquartile 25% (IQ1) | $71,493 | $51,594 |
| Interquartile 75% (IQ3) | $98,895 | $78,952 |
| Interquartile Range (IQR) | $27,402 | $27,358 |
| Standard Deviation (Sample) | $23,727 | $17,732 |
| Standard Deviation (Population) | $23,620 | $17,561 |
Similar Demographics by Householder Income Ages 25 - 44 years
Demographics Similar to Immigrants from Guyana by Householder Income Ages 25 - 44 years
In terms of householder income ages 25 - 44 years, the demographic groups most similar to Immigrants from Guyana are Barbadian ($89,565, a difference of 0.020%), Immigrants from Ecuador ($89,673, a difference of 0.10%), Immigrants from Panama ($89,451, a difference of 0.15%), Immigrants from Iraq ($89,444, a difference of 0.16%), and Immigrants from Trinidad and Tobago ($89,748, a difference of 0.18%).
| Demographics | Rating | Rank | Householder Income Ages 25 - 44 years |
| Ghanaians | 7.9 /100 | #216 | Tragic $90,137 |
| Scotch-Irish | 7.3 /100 | #217 | Tragic $89,969 |
| Guyanese | 7.1 /100 | #218 | Tragic $89,940 |
| Delaware | 6.9 /100 | #219 | Tragic $89,876 |
| Trinidadians and Tobagonians | 6.8 /100 | #220 | Tragic $89,856 |
| Immigrants | Trinidad and Tobago | 6.5 /100 | #221 | Tragic $89,748 |
| Immigrants | Ecuador | 6.2 /100 | #222 | Tragic $89,673 |
| Immigrants | Guyana | 5.9 /100 | #223 | Tragic $89,586 |
| Barbadians | 5.9 /100 | #224 | Tragic $89,565 |
| Immigrants | Panama | 5.5 /100 | #225 | Tragic $89,451 |
| Immigrants | Iraq | 5.5 /100 | #226 | Tragic $89,444 |
| Immigrants | St. Vincent and the Grenadines | 4.1 /100 | #227 | Tragic $88,888 |
| Immigrants | Bosnia and Herzegovina | 4.0 /100 | #228 | Tragic $88,819 |
| Immigrants | Barbados | 3.7 /100 | #229 | Tragic $88,687 |
| Alaskan Athabascans | 3.3 /100 | #230 | Tragic $88,446 |
Demographics Similar to Bahamians by Householder Income Ages 25 - 44 years
In terms of householder income ages 25 - 44 years, the demographic groups most similar to Bahamians are Native/Alaskan ($75,647, a difference of 0.34%), Hopi ($75,002, a difference of 0.52%), Creek ($74,847, a difference of 0.73%), Kiowa ($74,776, a difference of 0.83%), and Yakama ($76,226, a difference of 1.1%).
| Demographics | Rating | Rank | Householder Income Ages 25 - 44 years |
| Sioux | 0.0 /100 | #325 | Tragic $77,089 |
| Houma | 0.0 /100 | #326 | Tragic $77,044 |
| Immigrants | Bahamas | 0.0 /100 | #327 | Tragic $76,910 |
| Immigrants | Cuba | 0.0 /100 | #328 | Tragic $76,701 |
| Seminole | 0.0 /100 | #329 | Tragic $76,584 |
| Yakama | 0.0 /100 | #330 | Tragic $76,226 |
| Natives/Alaskans | 0.0 /100 | #331 | Tragic $75,647 |
| Bahamians | 0.0 /100 | #332 | Tragic $75,395 |
| Hopi | 0.0 /100 | #333 | Tragic $75,002 |
| Creek | 0.0 /100 | #334 | Tragic $74,847 |
| Kiowa | 0.0 /100 | #335 | Tragic $74,776 |
| Yup'ik | 0.0 /100 | #336 | Tragic $73,688 |
| Blacks/African Americans | 0.0 /100 | #337 | Tragic $73,370 |
| Immigrants | Yemen | 0.0 /100 | #338 | Tragic $73,043 |
| Yuman | 0.0 /100 | #339 | Tragic $72,956 |