Immigrants from Guyana vs Argentinean 1st Grade

COMPARE

Immigrants from Guyana
Race
Ancestry
AfghanAfricanAlaska NativeAlaskan AthabascanAlbanianAleutAlsatianAmericanApacheArabArapahoArmenianAssyrian/Chaldean/SyriacAustralianAustrianBahamianBangladeshiBarbadianBasqueBelgianBelizeanBermudanBhutaneseBlackfeetBolivianBrazilianBritishBritish West IndianBulgarianBurmeseCajunCambodianCanadianCape VerdeanCarpatho RusynCelticCentral AmericanCentral American IndianCherokeeCheyenneChickasawChileanChineseChippewaChoctawColombianColvilleComancheCosta RicanCreeCreekCroatianCrowCubanCypriotCzechCzechoslovakianDanishDelawareDominicanDutchDutch West IndianEastern EuropeanEcuadorianEgyptianEnglishEstonianEthiopianEuropeanFijianFilipinoFinnishFrenchFrench American IndianFrench CanadianGermanGerman RussianGhanaianGreekGuamanian/ChamorroGuatemalanGuyaneseHaitianHmongHonduranHopiHoumaHungarianIcelanderIndian (Asian)IndonesianInupiatIranianIraqiIrishIroquoisIsraeliItalianJamaicanJapaneseJordanianKenyanKiowaKoreanLaotianLatvianLebaneseLiberianLithuanianLumbeeLuxembourgerMacedonianMalaysianMalteseMarshalleseMenomineeMexicanMexican American IndianMongolianMoroccanNative HawaiianNavajoNepaleseNew ZealanderNicaraguanNigerianNorthern EuropeanNorwegianOkinawanOsageOttawaPaiutePakistaniPalestinianPanamanianParaguayanPennsylvania GermanPeruvianPimaPolishPortuguesePotawatomiPuebloPuerto RicanPuget Sound SalishRomanianRussianSalvadoranSamoanScandinavianScotch-IrishScottishSeminoleSenegaleseSerbianShoshoneSierra LeoneanSiouxSlavicSlovakSloveneSomaliSouth AfricanSouth AmericanSouth American IndianSoviet UnionSpaniardSpanishSpanish AmericanSpanish American IndianSri LankanSubsaharan AfricanSudaneseSwedishSwissSyrianTaiwaneseThaiTlingit-HaidaTohono O'OdhamTonganTrinidadian and TobagonianTsimshianTurkishU.S. Virgin IslanderUgandanUkrainianUruguayanUteVenezuelanVietnameseWelshWest IndianYakamaYaquiYugoslavianYumanYup'ikZimbabwean
Immigration
NonimmigrantsImmigrantsAfghanistanAfricaAlbaniaArgentinaArmeniaAsiaAustraliaAustriaBahamasBangladeshBarbadosBelarusBelgiumBelizeBoliviaBosnia and HerzegovinaBrazilBulgariaBurma/MyanmarCabo VerdeCambodiaCameroonCanadaCaribbeanCentral AmericaChileChinaColombiaCongoCosta RicaCroatiaCubaCzechoslovakiaDenmarkDominicaDominican RepublicEastern AfricaEastern AsiaEastern EuropeEcuadorEgyptEl SalvadorEnglandEritreaEthiopiaEuropeFijiFranceGermanyGhanaGreeceGrenadaGuatemalaGuyanaHaitiHondurasHong KongHungaryIndiaIndonesiaIranIraqIrelandIsraelItalyJamaicaJapanJordanKazakhstanKenyaKoreaKuwaitLaosLatin AmericaLatviaLebanonLiberiaLithuaniaMalaysiaMexicoMicronesiaMiddle AfricaMoldovaMoroccoNepalNetherlandsNicaraguaNigeriaNorth AmericaNorth MacedoniaNorthern AfricaNorthern EuropeNorwayOceaniaPakistanPanamaPeruPhilippinesPolandPortugalRomaniaRussiaSaudi ArabiaScotlandSenegalSerbiaSierra LeoneSingaporeSomaliaSouth AfricaSouth AmericaSouth Central AsiaSouth Eastern AsiaSouthern EuropeSpainSri LankaSt. Vincent and the GrenadinesSudanSwedenSwitzerlandSyriaTaiwanThailandTrinidad and TobagoTurkeyUgandaUkraineUruguayUzbekistanVenezuelaVietnamWest IndiesWestern AfricaWestern AsiaWestern EuropeYemenZaireZimbabweAzores
Argentinean
Race
Ancestry
AfghanAfricanAlaska NativeAlaskan AthabascanAlbanianAleutAlsatianAmericanApacheArabArapahoArgentineanArmenianAssyrian/Chaldean/SyriacAustralianAustrianBahamianBangladeshiBarbadianBasqueBelgianBelizeanBermudanBhutaneseBlackfeetBolivianBrazilianBritishBritish West IndianBulgarianBurmeseCajunCambodianCanadianCape VerdeanCarpatho RusynCelticCentral AmericanCentral American IndianCherokeeCheyenneChickasawChileanChineseChippewaChoctawColombianColvilleComancheCosta RicanCreeCreekCroatianCrowCubanCypriotCzechCzechoslovakianDanishDelawareDominicanDutchDutch West IndianEastern EuropeanEcuadorianEgyptianEnglishEstonianEthiopianEuropeanFijianFilipinoFinnishFrenchFrench American IndianFrench CanadianGermanGerman RussianGhanaianGreekGuamanian/ChamorroGuatemalanGuyaneseHaitianHmongHonduranHopiHoumaHungarianIcelanderIndian (Asian)IndonesianInupiatIranianIraqiIrishIroquoisIsraeliItalianJamaicanJapaneseJordanianKenyanKiowaKoreanLaotianLatvianLebaneseLiberianLithuanianLumbeeLuxembourgerMacedonianMalaysianMalteseMarshalleseMenomineeMexicanMexican American IndianMongolianMoroccanNative HawaiianNavajoNepaleseNew ZealanderNicaraguanNigerianNorthern EuropeanNorwegianOkinawanOsageOttawaPaiutePakistaniPalestinianPanamanianParaguayanPennsylvania GermanPeruvianPimaPolishPortuguesePotawatomiPuebloPuerto RicanPuget Sound SalishRomanianRussianSalvadoranSamoanScandinavianScotch-IrishScottishSeminoleSenegaleseSerbianShoshoneSierra LeoneanSiouxSlavicSlovakSloveneSomaliSouth AfricanSouth AmericanSouth American IndianSoviet UnionSpaniardSpanishSpanish AmericanSpanish American IndianSri LankanSubsaharan AfricanSudaneseSwedishSwissSyrianTaiwaneseThaiTlingit-HaidaTohono O'OdhamTonganTrinidadian and TobagonianTsimshianTurkishU.S. Virgin IslanderUgandanUkrainianUruguayanUteVenezuelanVietnameseWelshWest IndianYakamaYaquiYugoslavianYumanYup'ikZimbabwean
Immigration
NonimmigrantsImmigrantsAfghanistanAfricaAlbaniaArgentinaArmeniaAsiaAustraliaAustriaBahamasBangladeshBarbadosBelarusBelgiumBelizeBoliviaBosnia and HerzegovinaBrazilBulgariaBurma/MyanmarCabo VerdeCambodiaCameroonCanadaCaribbeanCentral AmericaChileChinaColombiaCongoCosta RicaCroatiaCubaCzechoslovakiaDenmarkDominicaDominican RepublicEastern AfricaEastern AsiaEastern EuropeEcuadorEgyptEl SalvadorEnglandEritreaEthiopiaEuropeFijiFranceGermanyGhanaGreeceGrenadaGuatemalaHaitiHondurasHong KongHungaryIndiaIndonesiaIranIraqIrelandIsraelItalyJamaicaJapanJordanKazakhstanKenyaKoreaKuwaitLaosLatin AmericaLatviaLebanonLiberiaLithuaniaMalaysiaMexicoMicronesiaMiddle AfricaMoldovaMoroccoNepalNetherlandsNicaraguaNigeriaNorth AmericaNorth MacedoniaNorthern AfricaNorthern EuropeNorwayOceaniaPakistanPanamaPeruPhilippinesPolandPortugalRomaniaRussiaSaudi ArabiaScotlandSenegalSerbiaSierra LeoneSingaporeSomaliaSouth AfricaSouth AmericaSouth Central AsiaSouth Eastern AsiaSouthern EuropeSpainSri LankaSt. Vincent and the GrenadinesSudanSwedenSwitzerlandSyriaTaiwanThailandTrinidad and TobagoTurkeyUgandaUkraineUruguayUzbekistanVenezuelaVietnamWest IndiesWestern AfricaWestern AsiaWestern EuropeYemenZaireZimbabweAzores
1st Grade
Income
Poverty
Unemployment
Labor Participation
Family Structure
Vehicle Availability
Education Level
Disability

1st Grade Comparison

Immigrants from Guyana

Argentineans

Tragic
Average
96.8%
1ST GRADE
0.0/ 100
METRIC RATING
319th/ 347
METRIC RANK
97.9%
1ST GRADE
47.2/ 100
METRIC RATING
179th/ 347
METRIC RANK

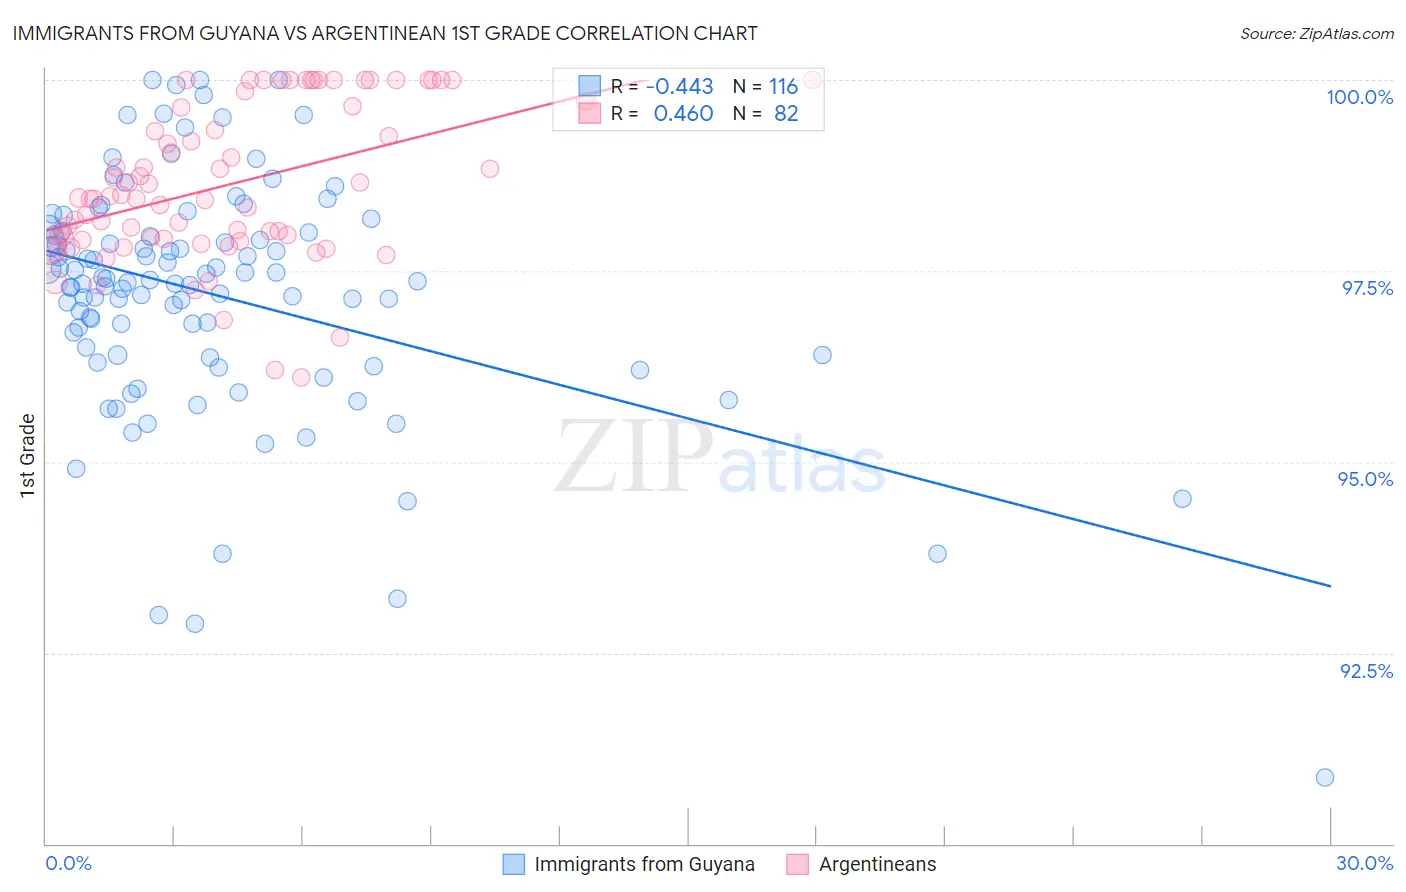
Immigrants from Guyana vs Argentinean 1st Grade Correlation Chart

The statistical analysis conducted on geographies consisting of 183,746,342 people shows a moderate negative correlation between the proportion of Immigrants from Guyana and percentage of population with at least 1st grade education in the United States with a correlation coefficient (R) of -0.443 and weighted average of 96.8%. Similarly, the statistical analysis conducted on geographies consisting of 297,146,811 people shows a moderate positive correlation between the proportion of Argentineans and percentage of population with at least 1st grade education in the United States with a correlation coefficient (R) of 0.460 and weighted average of 97.9%, a difference of 1.1%.
Immigrants from Guyana vs Argentinean 1st Grade

1st Grade Correlation Summary

MeasurementImmigrants from GuyanaArgentinean
Minimum90.9%96.1%
Maximum100.0%100.0%
Range9.1%3.9%
Mean97.2%98.6%
Median97.4%98.5%
Interquartile 25% (IQ1)96.4%97.9%
Interquartile 75% (IQ3)98.0%99.7%
Interquartile Range (IQR)1.6%1.8%
Standard Deviation (Sample)1.6%1.0%
Standard Deviation (Population)1.6%1.0%

Similar Demographics by 1st Grade

Demographics Similar to Immigrants from Guyana by 1st Grade

In terms of 1st grade, the demographic groups most similar to Immigrants from Guyana are Immigrants from Burma/Myanmar (96.8%, a difference of 0.0%), Immigrants from Laos (96.8%, a difference of 0.010%), Immigrants from Bangladesh (96.8%, a difference of 0.010%), Mexican American Indian (96.8%, a difference of 0.030%), and Immigrants from Honduras (96.8%, a difference of 0.030%).
DemographicsRating | Rank1st Grade
Cape Verdeans
0.0
/100
|
#312
Tragic
96.9%
Guyanese
0.0
/100
|
#313
Tragic
96.9%
Hondurans
0.0
/100
|
#314
Tragic
96.9%
Immigrants | Belize
0.0
/100
|
#315
Tragic
96.9%
Immigrants | Ecuador
0.0
/100
|
#316
Tragic
96.9%
Immigrants | Nicaragua
0.0
/100
|
#317
Tragic
96.9%
Immigrants | Laos
0.0
/100
|
#318
Tragic
96.8%
Immigrants | Guyana
0.0
/100
|
#319
Tragic
96.8%
Immigrants | Burma/Myanmar
0.0
/100
|
#320
Tragic
96.8%
Immigrants | Bangladesh
0.0
/100
|
#321
Tragic
96.8%
Mexican American Indians
0.0
/100
|
#322
Tragic
96.8%
Immigrants | Honduras
0.0
/100
|
#323
Tragic
96.8%
Vietnamese
0.0
/100
|
#324
Tragic
96.8%
Dominicans
0.0
/100
|
#325
Tragic
96.7%
Indonesians
0.0
/100
|
#326
Tragic
96.7%

Demographics Similar to Argentineans by 1st Grade

In terms of 1st grade, the demographic groups most similar to Argentineans are Immigrants from Venezuela (97.9%, a difference of 0.0%), Immigrants from Bosnia and Herzegovina (97.9%, a difference of 0.0%), Kenyan (97.9%, a difference of 0.010%), Native/Alaskan (97.9%, a difference of 0.010%), and Immigrants from Sri Lanka (97.9%, a difference of 0.010%).
DemographicsRating | Rank1st Grade
Immigrants | Korea
53.0
/100
|
#172
Average
97.9%
Kenyans
51.2
/100
|
#173
Average
97.9%
Natives/Alaskans
50.0
/100
|
#174
Average
97.9%
Immigrants | Sri Lanka
49.7
/100
|
#175
Average
97.9%
Albanians
49.6
/100
|
#176
Average
97.9%
Immigrants | Brazil
49.1
/100
|
#177
Average
97.9%
Immigrants | Venezuela
47.8
/100
|
#178
Average
97.9%
Argentineans
47.2
/100
|
#179
Average
97.9%
Immigrants | Bosnia and Herzegovina
46.6
/100
|
#180
Average
97.9%
Portuguese
44.2
/100
|
#181
Average
97.9%
Egyptians
42.7
/100
|
#182
Average
97.9%
Immigrants | Argentina
41.3
/100
|
#183
Average
97.9%
Immigrants | Poland
40.1
/100
|
#184
Average
97.9%
Immigrants | Belarus
39.3
/100
|
#185
Fair
97.9%
Paiute
36.5
/100
|
#186
Fair
97.9%