Immigrants from Guatemala vs Native Hawaiian Professional Degree
COMPARE
Immigrants from Guatemala
Native Hawaiian
Professional Degree
Professional Degree Comparison
Immigrants from Guatemala
Native Hawaiians
3.4%
PROFESSIONAL DEGREE
0.2/ 100
METRIC RATING
295th/ 347
METRIC RANK
3.8%
PROFESSIONAL DEGREE
2.3/ 100
METRIC RATING
242nd/ 347
METRIC RANK
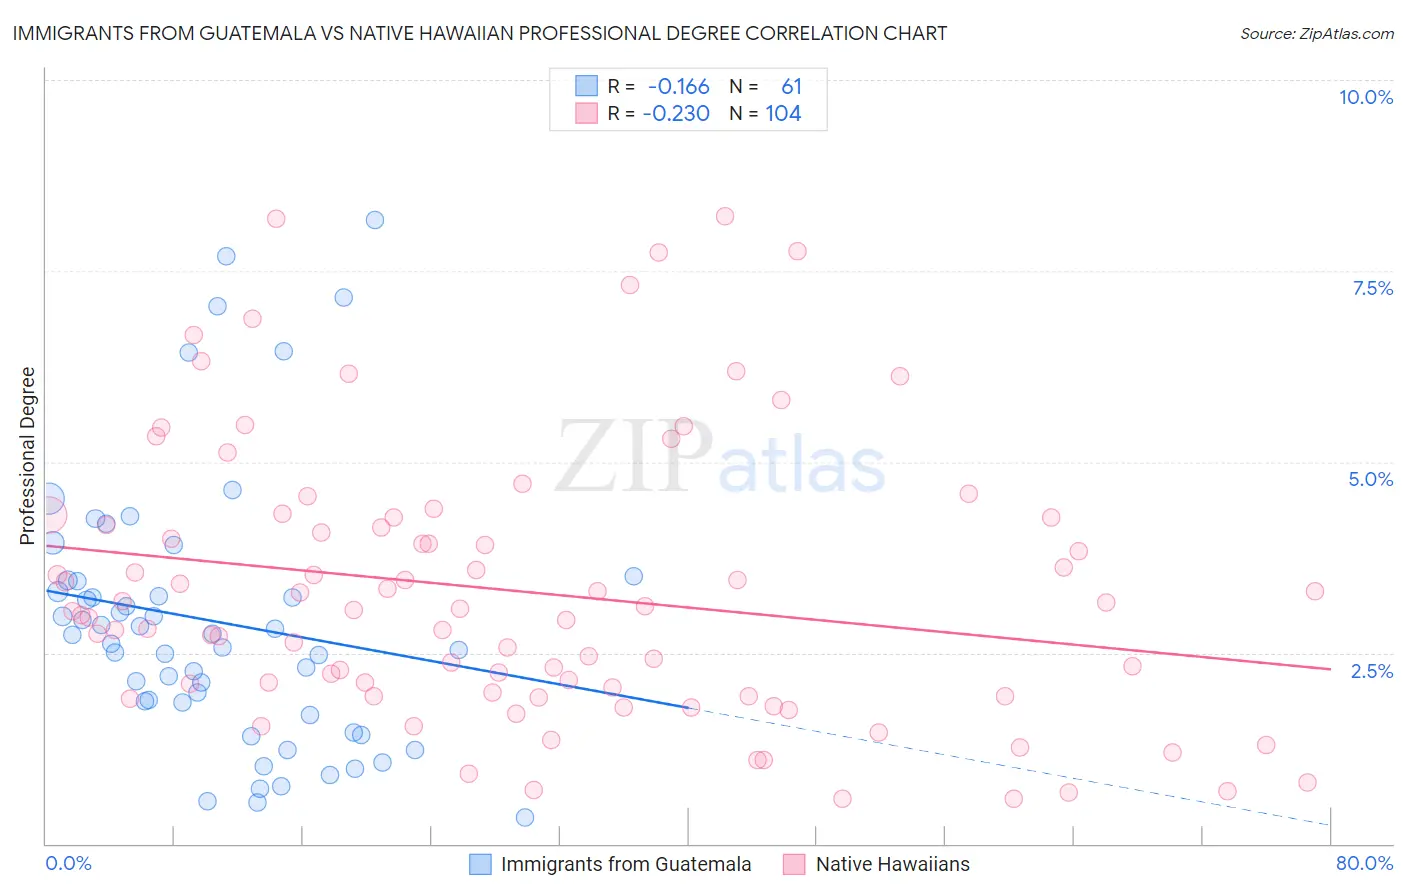
Immigrants from Guatemala vs Native Hawaiian Professional Degree Correlation Chart
The statistical analysis conducted on geographies consisting of 376,144,765 people shows a poor negative correlation between the proportion of Immigrants from Guatemala and percentage of population with at least professional degree education in the United States with a correlation coefficient (R) of -0.166 and weighted average of 3.4%. Similarly, the statistical analysis conducted on geographies consisting of 331,121,710 people shows a weak negative correlation between the proportion of Native Hawaiians and percentage of population with at least professional degree education in the United States with a correlation coefficient (R) of -0.230 and weighted average of 3.8%, a difference of 10.5%.
Professional Degree Correlation Summary
| Measurement | Immigrants from Guatemala | Native Hawaiian |
| Minimum | 0.34% | 0.59% |
| Maximum | 8.2% | 8.2% |
| Range | 7.8% | 7.6% |
| Mean | 2.9% | 3.3% |
| Median | 2.7% | 3.0% |
| Interquartile 25% (IQ1) | 1.8% | 2.0% |
| Interquartile 75% (IQ3) | 3.4% | 4.2% |
| Interquartile Range (IQR) | 1.7% | 2.3% |
| Standard Deviation (Sample) | 1.8% | 1.8% |
| Standard Deviation (Population) | 1.8% | 1.8% |
Similar Demographics by Professional Degree
Demographics Similar to Immigrants from Guatemala by Professional Degree
In terms of professional degree, the demographic groups most similar to Immigrants from Guatemala are Hawaiian (3.4%, a difference of 0.010%), Paiute (3.4%, a difference of 0.16%), Immigrants from Honduras (3.5%, a difference of 0.24%), Immigrants from Liberia (3.4%, a difference of 0.35%), and Ottawa (3.4%, a difference of 0.40%).
| Demographics | Rating | Rank | Professional Degree |
| Blackfeet | 0.3 /100 | #288 | Tragic 3.5% |
| Guatemalans | 0.3 /100 | #289 | Tragic 3.5% |
| Chippewa | 0.3 /100 | #290 | Tragic 3.5% |
| Alaska Natives | 0.3 /100 | #291 | Tragic 3.5% |
| Immigrants | Belize | 0.3 /100 | #292 | Tragic 3.5% |
| Immigrants | Honduras | 0.3 /100 | #293 | Tragic 3.5% |
| Paiute | 0.3 /100 | #294 | Tragic 3.4% |
| Immigrants | Guatemala | 0.2 /100 | #295 | Tragic 3.4% |
| Hawaiians | 0.2 /100 | #296 | Tragic 3.4% |
| Immigrants | Liberia | 0.2 /100 | #297 | Tragic 3.4% |
| Ottawa | 0.2 /100 | #298 | Tragic 3.4% |
| Immigrants | Yemen | 0.2 /100 | #299 | Tragic 3.4% |
| Blacks/African Americans | 0.2 /100 | #300 | Tragic 3.4% |
| Immigrants | Dominican Republic | 0.2 /100 | #301 | Tragic 3.4% |
| Malaysians | 0.2 /100 | #302 | Tragic 3.4% |
Demographics Similar to Native Hawaiians by Professional Degree
In terms of professional degree, the demographic groups most similar to Native Hawaiians are Alaskan Athabascan (3.8%, a difference of 0.0%), Immigrants from Ecuador (3.8%, a difference of 0.020%), Guamanian/Chamorro (3.8%, a difference of 0.080%), British West Indian (3.8%, a difference of 0.25%), and Immigrants from Bahamas (3.8%, a difference of 0.51%).
| Demographics | Rating | Rank | Professional Degree |
| Immigrants | Barbados | 4.0 /100 | #235 | Tragic 3.9% |
| Spanish Americans | 3.8 /100 | #236 | Tragic 3.9% |
| Immigrants | Trinidad and Tobago | 3.8 /100 | #237 | Tragic 3.9% |
| Colville | 2.6 /100 | #238 | Tragic 3.8% |
| British West Indians | 2.4 /100 | #239 | Tragic 3.8% |
| Immigrants | Ecuador | 2.3 /100 | #240 | Tragic 3.8% |
| Alaskan Athabascans | 2.3 /100 | #241 | Tragic 3.8% |
| Native Hawaiians | 2.3 /100 | #242 | Tragic 3.8% |
| Guamanians/Chamorros | 2.2 /100 | #243 | Tragic 3.8% |
| Immigrants | Bahamas | 2.0 /100 | #244 | Tragic 3.8% |
| French American Indians | 1.7 /100 | #245 | Tragic 3.8% |
| Marshallese | 1.7 /100 | #246 | Tragic 3.8% |
| Guyanese | 1.6 /100 | #247 | Tragic 3.8% |
| Hmong | 1.6 /100 | #248 | Tragic 3.7% |
| Immigrants | Grenada | 1.5 /100 | #249 | Tragic 3.7% |