Ugandan vs Immigrants from Taiwan Householder Income Over 65 years
COMPARE
Ugandan
Immigrants from Taiwan
Householder Income Over 65 years
Householder Income Over 65 years Comparison
Ugandans
Immigrants from Taiwan
$61,177
HOUSEHOLDER INCOME OVER 65 YEARS
55.5/ 100
METRIC RATING
163rd/ 347
METRIC RANK
$77,051
HOUSEHOLDER INCOME OVER 65 YEARS
100.0/ 100
METRIC RATING
3rd/ 347
METRIC RANK
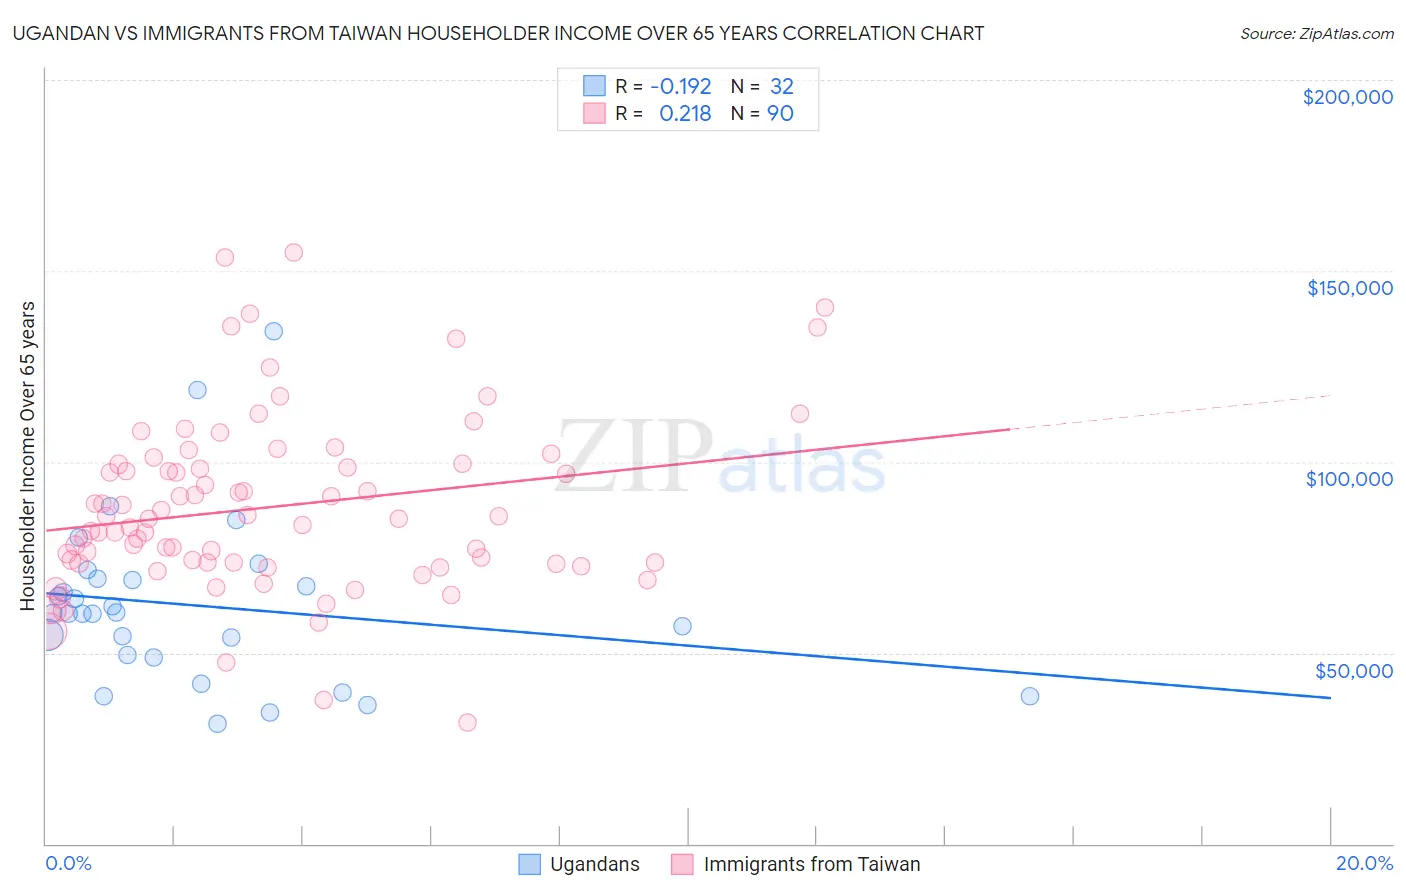
Ugandan vs Immigrants from Taiwan Householder Income Over 65 years Correlation Chart
The statistical analysis conducted on geographies consisting of 93,951,577 people shows a poor negative correlation between the proportion of Ugandans and household income with householder over the age of 65 in the United States with a correlation coefficient (R) of -0.192 and weighted average of $61,177. Similarly, the statistical analysis conducted on geographies consisting of 297,705,032 people shows a weak positive correlation between the proportion of Immigrants from Taiwan and household income with householder over the age of 65 in the United States with a correlation coefficient (R) of 0.218 and weighted average of $77,051, a difference of 26.0%.
Householder Income Over 65 years Correlation Summary
| Measurement | Ugandan | Immigrants from Taiwan |
| Minimum | $31,513 | $31,867 |
| Maximum | $134,340 | $154,709 |
| Range | $102,827 | $122,842 |
| Mean | $62,320 | $88,175 |
| Median | $60,326 | $85,060 |
| Interquartile 25% (IQ1) | $49,062 | $73,583 |
| Interquartile 75% (IQ3) | $69,172 | $99,353 |
| Interquartile Range (IQR) | $20,109 | $25,770 |
| Standard Deviation (Sample) | $22,191 | $23,073 |
| Standard Deviation (Population) | $21,841 | $22,945 |
Similar Demographics by Householder Income Over 65 years
Demographics Similar to Ugandans by Householder Income Over 65 years
In terms of householder income over 65 years, the demographic groups most similar to Ugandans are Immigrants from North Macedonia ($61,175, a difference of 0.0%), Immigrants from Ukraine ($61,163, a difference of 0.020%), Immigrants from Eastern Africa ($61,157, a difference of 0.030%), Czech ($61,244, a difference of 0.11%), and Norwegian ($61,104, a difference of 0.12%).
| Demographics | Rating | Rank | Householder Income Over 65 years |
| Scandinavians | 65.6 /100 | #156 | Good $61,586 |
| Macedonians | 65.1 /100 | #157 | Good $61,564 |
| English | 63.3 /100 | #158 | Good $61,487 |
| Brazilians | 62.7 /100 | #159 | Good $61,465 |
| Portuguese | 62.1 /100 | #160 | Good $61,440 |
| Icelanders | 57.9 /100 | #161 | Average $61,270 |
| Czechs | 57.2 /100 | #162 | Average $61,244 |
| Ugandans | 55.5 /100 | #163 | Average $61,177 |
| Immigrants | North Macedonia | 55.4 /100 | #164 | Average $61,175 |
| Immigrants | Ukraine | 55.1 /100 | #165 | Average $61,163 |
| Immigrants | Eastern Africa | 55.0 /100 | #166 | Average $61,157 |
| Norwegians | 53.6 /100 | #167 | Average $61,104 |
| Irish | 53.4 /100 | #168 | Average $61,097 |
| Carpatho Rusyns | 53.3 /100 | #169 | Average $61,093 |
| Serbians | 53.1 /100 | #170 | Average $61,087 |
Demographics Similar to Immigrants from Taiwan by Householder Income Over 65 years
In terms of householder income over 65 years, the demographic groups most similar to Immigrants from Taiwan are Filipino ($76,686, a difference of 0.48%), Iranian ($77,429, a difference of 0.49%), Chinese ($77,465, a difference of 0.54%), Immigrants from Iran ($75,081, a difference of 2.6%), and Bolivian ($74,245, a difference of 3.8%).
| Demographics | Rating | Rank | Householder Income Over 65 years |
| Chinese | 100.0 /100 | #1 | Exceptional $77,465 |
| Iranians | 100.0 /100 | #2 | Exceptional $77,429 |
| Immigrants | Taiwan | 100.0 /100 | #3 | Exceptional $77,051 |
| Filipinos | 100.0 /100 | #4 | Exceptional $76,686 |
| Immigrants | Iran | 100.0 /100 | #5 | Exceptional $75,081 |
| Bolivians | 100.0 /100 | #6 | Exceptional $74,245 |
| Immigrants | Bolivia | 100.0 /100 | #7 | Exceptional $73,434 |
| Immigrants | Singapore | 100.0 /100 | #8 | Exceptional $72,963 |
| Immigrants | India | 100.0 /100 | #9 | Exceptional $72,804 |
| Bhutanese | 100.0 /100 | #10 | Exceptional $72,288 |
| Thais | 100.0 /100 | #11 | Exceptional $72,099 |
| Cypriots | 100.0 /100 | #12 | Exceptional $71,714 |
| Immigrants | Hong Kong | 100.0 /100 | #13 | Exceptional $71,567 |
| Burmese | 100.0 /100 | #14 | Exceptional $71,139 |
| Native Hawaiians | 100.0 /100 | #15 | Exceptional $71,021 |