Immigrants from Ghana vs Ecuadorian Householder Income Ages 25 - 44 years
COMPARE
Immigrants from Ghana
Ecuadorian
Householder Income Ages 25 - 44 years
Householder Income Ages 25 - 44 years Comparison
Immigrants from Ghana
Ecuadorians
$87,760
HOUSEHOLDER INCOME AGES 25 - 44 YEARS
2.2/ 100
METRIC RATING
239th/ 347
METRIC RANK
$91,574
HOUSEHOLDER INCOME AGES 25 - 44 YEARS
16.0/ 100
METRIC RATING
202nd/ 347
METRIC RANK
Immigrants from Ghana vs Ecuadorian Householder Income Ages 25 - 44 years Correlation Chart
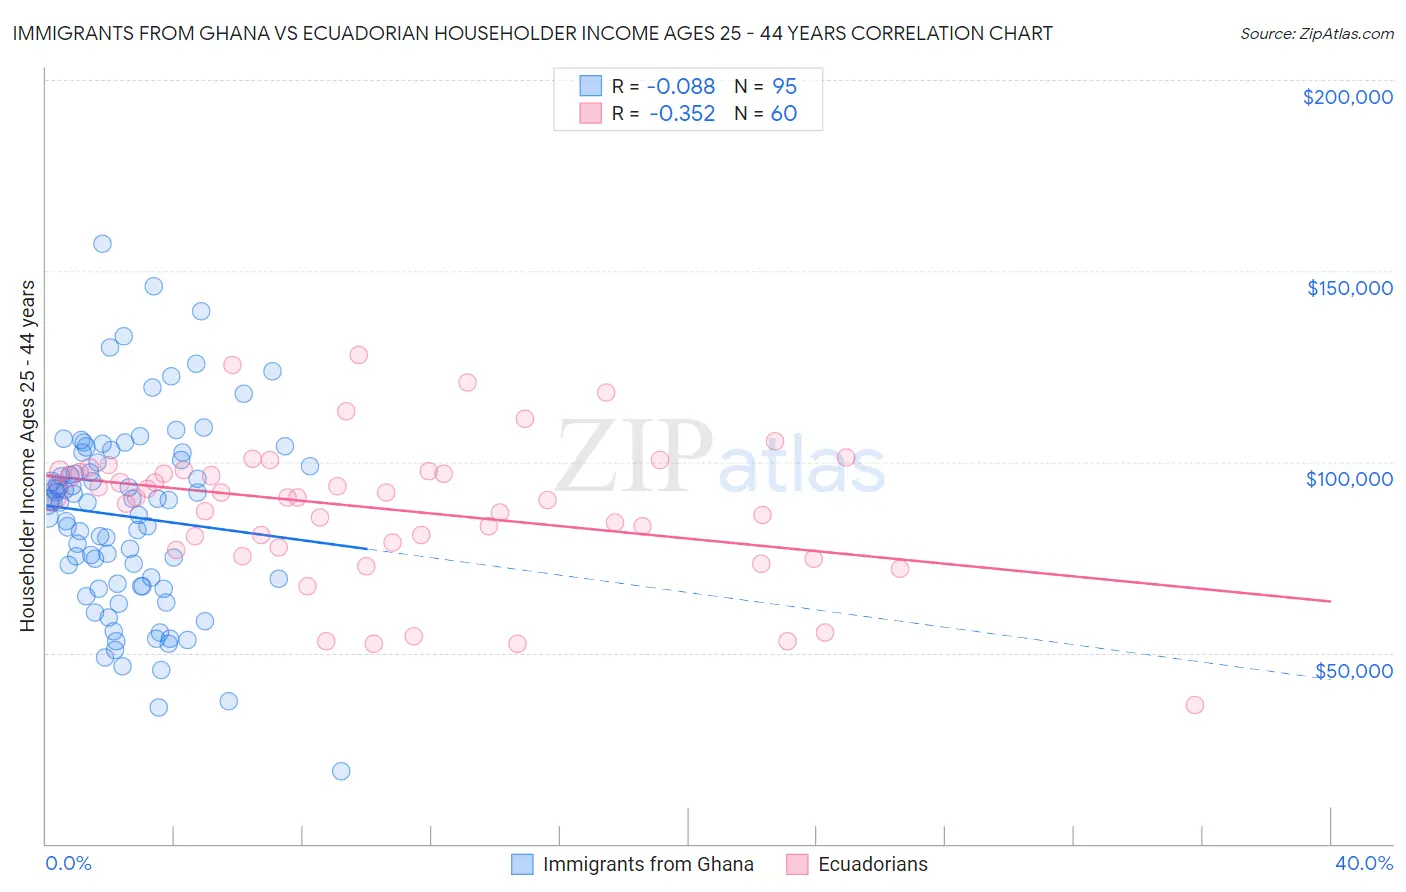
The statistical analysis conducted on geographies consisting of 199,650,351 people shows a slight negative correlation between the proportion of Immigrants from Ghana and household income with householder between the ages 25 and 44 in the United States with a correlation coefficient (R) of -0.088 and weighted average of $87,760. Similarly, the statistical analysis conducted on geographies consisting of 317,341,499 people shows a mild negative correlation between the proportion of Ecuadorians and household income with householder between the ages 25 and 44 in the United States with a correlation coefficient (R) of -0.352 and weighted average of $91,574, a difference of 4.3%.
Householder Income Ages 25 - 44 years Correlation Summary
| Measurement | Immigrants from Ghana | Ecuadorian |
| Minimum | $18,980 | $36,176 |
| Maximum | $157,070 | $127,966 |
| Range | $138,090 | $91,790 |
| Mean | $85,645 | $87,639 |
| Median | $89,488 | $90,671 |
| Interquartile 25% (IQ1) | $67,346 | $78,277 |
| Interquartile 75% (IQ3) | $100,333 | $97,520 |
| Interquartile Range (IQR) | $32,987 | $19,243 |
| Standard Deviation (Sample) | $24,889 | $18,484 |
| Standard Deviation (Population) | $24,757 | $18,329 |
Similar Demographics by Householder Income Ages 25 - 44 years
Demographics Similar to Immigrants from Ghana by Householder Income Ages 25 - 44 years
In terms of householder income ages 25 - 44 years, the demographic groups most similar to Immigrants from Ghana are Nicaraguan ($87,751, a difference of 0.010%), Nigerian ($87,730, a difference of 0.030%), Alaska Native ($88,018, a difference of 0.29%), Salvadoran ($88,198, a difference of 0.50%), and Immigrants from Cameroon ($88,214, a difference of 0.52%).
| Demographics | Rating | Rank | Householder Income Ages 25 - 44 years |
| Immigrants | Nonimmigrants | 3.0 /100 | #232 | Tragic $88,301 |
| Malaysians | 3.0 /100 | #233 | Tragic $88,291 |
| Venezuelans | 2.9 /100 | #234 | Tragic $88,232 |
| Bermudans | 2.9 /100 | #235 | Tragic $88,231 |
| Immigrants | Cameroon | 2.9 /100 | #236 | Tragic $88,214 |
| Salvadorans | 2.8 /100 | #237 | Tragic $88,198 |
| Alaska Natives | 2.6 /100 | #238 | Tragic $88,018 |
| Immigrants | Ghana | 2.2 /100 | #239 | Tragic $87,760 |
| Nicaraguans | 2.2 /100 | #240 | Tragic $87,751 |
| Nigerians | 2.2 /100 | #241 | Tragic $87,730 |
| West Indians | 1.7 /100 | #242 | Tragic $87,205 |
| Immigrants | West Indies | 1.5 /100 | #243 | Tragic $87,063 |
| Immigrants | Venezuela | 1.5 /100 | #244 | Tragic $87,038 |
| Immigrants | El Salvador | 1.4 /100 | #245 | Tragic $86,913 |
| Immigrants | Burma/Myanmar | 1.3 /100 | #246 | Tragic $86,736 |
Demographics Similar to Ecuadorians by Householder Income Ages 25 - 44 years
In terms of householder income ages 25 - 44 years, the demographic groups most similar to Ecuadorians are Immigrants from Cambodia ($91,533, a difference of 0.040%), Japanese ($91,624, a difference of 0.050%), Nepalese ($91,498, a difference of 0.080%), White/Caucasian ($91,668, a difference of 0.10%), and Kenyan ($91,684, a difference of 0.12%).
| Demographics | Rating | Rank | Householder Income Ages 25 - 44 years |
| Celtics | 21.6 /100 | #195 | Fair $92,241 |
| Immigrants | Colombia | 21.3 /100 | #196 | Fair $92,204 |
| Spanish | 21.2 /100 | #197 | Fair $92,200 |
| Vietnamese | 20.2 /100 | #198 | Fair $92,089 |
| Kenyans | 16.8 /100 | #199 | Poor $91,684 |
| Whites/Caucasians | 16.7 /100 | #200 | Poor $91,668 |
| Japanese | 16.4 /100 | #201 | Poor $91,624 |
| Ecuadorians | 16.0 /100 | #202 | Poor $91,574 |
| Immigrants | Cambodia | 15.7 /100 | #203 | Poor $91,533 |
| Nepalese | 15.4 /100 | #204 | Poor $91,498 |
| Immigrants | Eastern Africa | 15.2 /100 | #205 | Poor $91,458 |
| Aleuts | 14.5 /100 | #206 | Poor $91,370 |
| Yugoslavians | 14.5 /100 | #207 | Poor $91,368 |
| Immigrants | Thailand | 14.3 /100 | #208 | Poor $91,337 |
| Immigrants | Uruguay | 13.2 /100 | #209 | Poor $91,171 |