Immigrants from Ghana vs Immigrants from Portugal Householder Income Ages 25 - 44 years
COMPARE
Immigrants from Ghana
Immigrants from Portugal
Householder Income Ages 25 - 44 years
Householder Income Ages 25 - 44 years Comparison
Immigrants from Ghana
Immigrants from Portugal
$87,760
HOUSEHOLDER INCOME AGES 25 - 44 YEARS
2.2/ 100
METRIC RATING
239th/ 347
METRIC RANK
$95,512
HOUSEHOLDER INCOME AGES 25 - 44 YEARS
62.8/ 100
METRIC RATING
161st/ 347
METRIC RANK
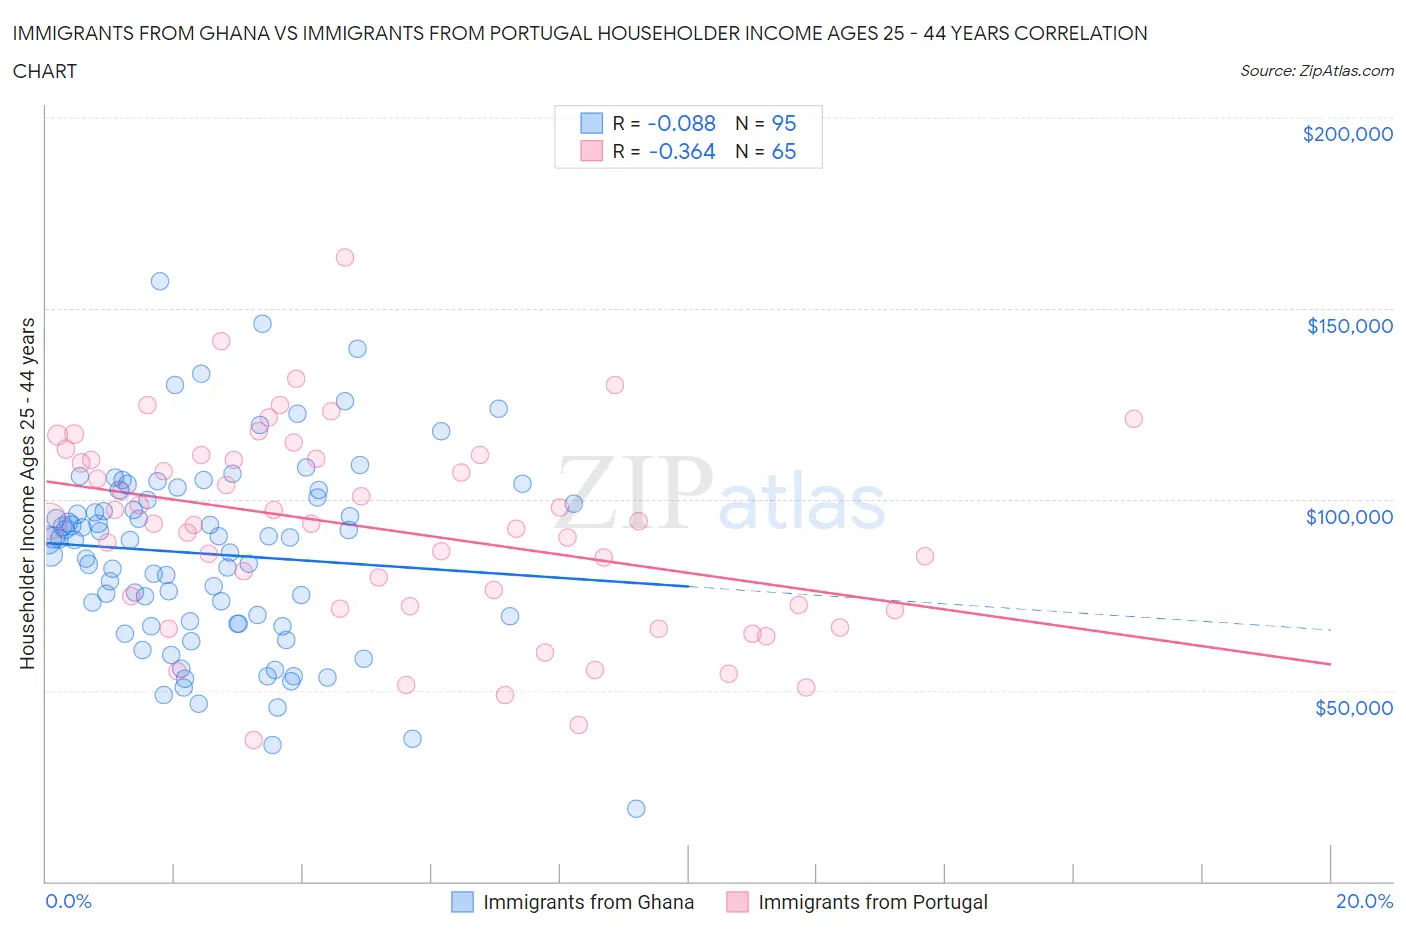
Immigrants from Ghana vs Immigrants from Portugal Householder Income Ages 25 - 44 years Correlation Chart
The statistical analysis conducted on geographies consisting of 199,650,351 people shows a slight negative correlation between the proportion of Immigrants from Ghana and household income with householder between the ages 25 and 44 in the United States with a correlation coefficient (R) of -0.088 and weighted average of $87,760. Similarly, the statistical analysis conducted on geographies consisting of 174,576,361 people shows a mild negative correlation between the proportion of Immigrants from Portugal and household income with householder between the ages 25 and 44 in the United States with a correlation coefficient (R) of -0.364 and weighted average of $95,512, a difference of 8.8%.
Householder Income Ages 25 - 44 years Correlation Summary
| Measurement | Immigrants from Ghana | Immigrants from Portugal |
| Minimum | $18,980 | $36,913 |
| Maximum | $157,070 | $163,387 |
| Range | $138,090 | $126,474 |
| Mean | $85,645 | $92,248 |
| Median | $89,488 | $93,647 |
| Interquartile 25% (IQ1) | $67,346 | $71,683 |
| Interquartile 75% (IQ3) | $100,333 | $111,037 |
| Interquartile Range (IQR) | $32,987 | $39,354 |
| Standard Deviation (Sample) | $24,889 | $26,108 |
| Standard Deviation (Population) | $24,757 | $25,907 |
Similar Demographics by Householder Income Ages 25 - 44 years
Demographics Similar to Immigrants from Ghana by Householder Income Ages 25 - 44 years
In terms of householder income ages 25 - 44 years, the demographic groups most similar to Immigrants from Ghana are Nicaraguan ($87,751, a difference of 0.010%), Nigerian ($87,730, a difference of 0.030%), Alaska Native ($88,018, a difference of 0.29%), Salvadoran ($88,198, a difference of 0.50%), and Immigrants from Cameroon ($88,214, a difference of 0.52%).
| Demographics | Rating | Rank | Householder Income Ages 25 - 44 years |
| Immigrants | Nonimmigrants | 3.0 /100 | #232 | Tragic $88,301 |
| Malaysians | 3.0 /100 | #233 | Tragic $88,291 |
| Venezuelans | 2.9 /100 | #234 | Tragic $88,232 |
| Bermudans | 2.9 /100 | #235 | Tragic $88,231 |
| Immigrants | Cameroon | 2.9 /100 | #236 | Tragic $88,214 |
| Salvadorans | 2.8 /100 | #237 | Tragic $88,198 |
| Alaska Natives | 2.6 /100 | #238 | Tragic $88,018 |
| Immigrants | Ghana | 2.2 /100 | #239 | Tragic $87,760 |
| Nicaraguans | 2.2 /100 | #240 | Tragic $87,751 |
| Nigerians | 2.2 /100 | #241 | Tragic $87,730 |
| West Indians | 1.7 /100 | #242 | Tragic $87,205 |
| Immigrants | West Indies | 1.5 /100 | #243 | Tragic $87,063 |
| Immigrants | Venezuela | 1.5 /100 | #244 | Tragic $87,038 |
| Immigrants | El Salvador | 1.4 /100 | #245 | Tragic $86,913 |
| Immigrants | Burma/Myanmar | 1.3 /100 | #246 | Tragic $86,736 |
Demographics Similar to Immigrants from Portugal by Householder Income Ages 25 - 44 years
In terms of householder income ages 25 - 44 years, the demographic groups most similar to Immigrants from Portugal are Swiss ($95,511, a difference of 0.0%), Icelander ($95,560, a difference of 0.050%), Costa Rican ($95,565, a difference of 0.060%), Immigrants from Saudi Arabia ($95,450, a difference of 0.070%), and Scandinavian ($95,596, a difference of 0.090%).
| Demographics | Rating | Rank | Householder Income Ages 25 - 44 years |
| Slavs | 73.2 /100 | #154 | Good $96,377 |
| Moroccans | 70.3 /100 | #155 | Good $96,117 |
| Immigrants | Germany | 67.9 /100 | #156 | Good $95,913 |
| Immigrants | Uganda | 65.2 /100 | #157 | Good $95,698 |
| Scandinavians | 63.9 /100 | #158 | Good $95,596 |
| Costa Ricans | 63.5 /100 | #159 | Good $95,565 |
| Icelanders | 63.4 /100 | #160 | Good $95,560 |
| Immigrants | Portugal | 62.8 /100 | #161 | Good $95,512 |
| Swiss | 62.8 /100 | #162 | Good $95,511 |
| Immigrants | Saudi Arabia | 62.0 /100 | #163 | Good $95,450 |
| South Americans | 60.9 /100 | #164 | Good $95,362 |
| Immigrants | Nepal | 60.3 /100 | #165 | Good $95,322 |
| Immigrants | Ethiopia | 59.5 /100 | #166 | Average $95,256 |
| Czechoslovakians | 57.0 /100 | #167 | Average $95,070 |
| Alsatians | 56.8 /100 | #168 | Average $95,059 |