Danish vs Immigrants from Portugal Householder Income Ages 25 - 44 years
COMPARE
Danish
Immigrants from Portugal
Householder Income Ages 25 - 44 years
Householder Income Ages 25 - 44 years Comparison
Danes
Immigrants from Portugal
$97,221
HOUSEHOLDER INCOME AGES 25 - 44 YEARS
81.3/ 100
METRIC RATING
142nd/ 347
METRIC RANK
$95,512
HOUSEHOLDER INCOME AGES 25 - 44 YEARS
62.8/ 100
METRIC RATING
161st/ 347
METRIC RANK
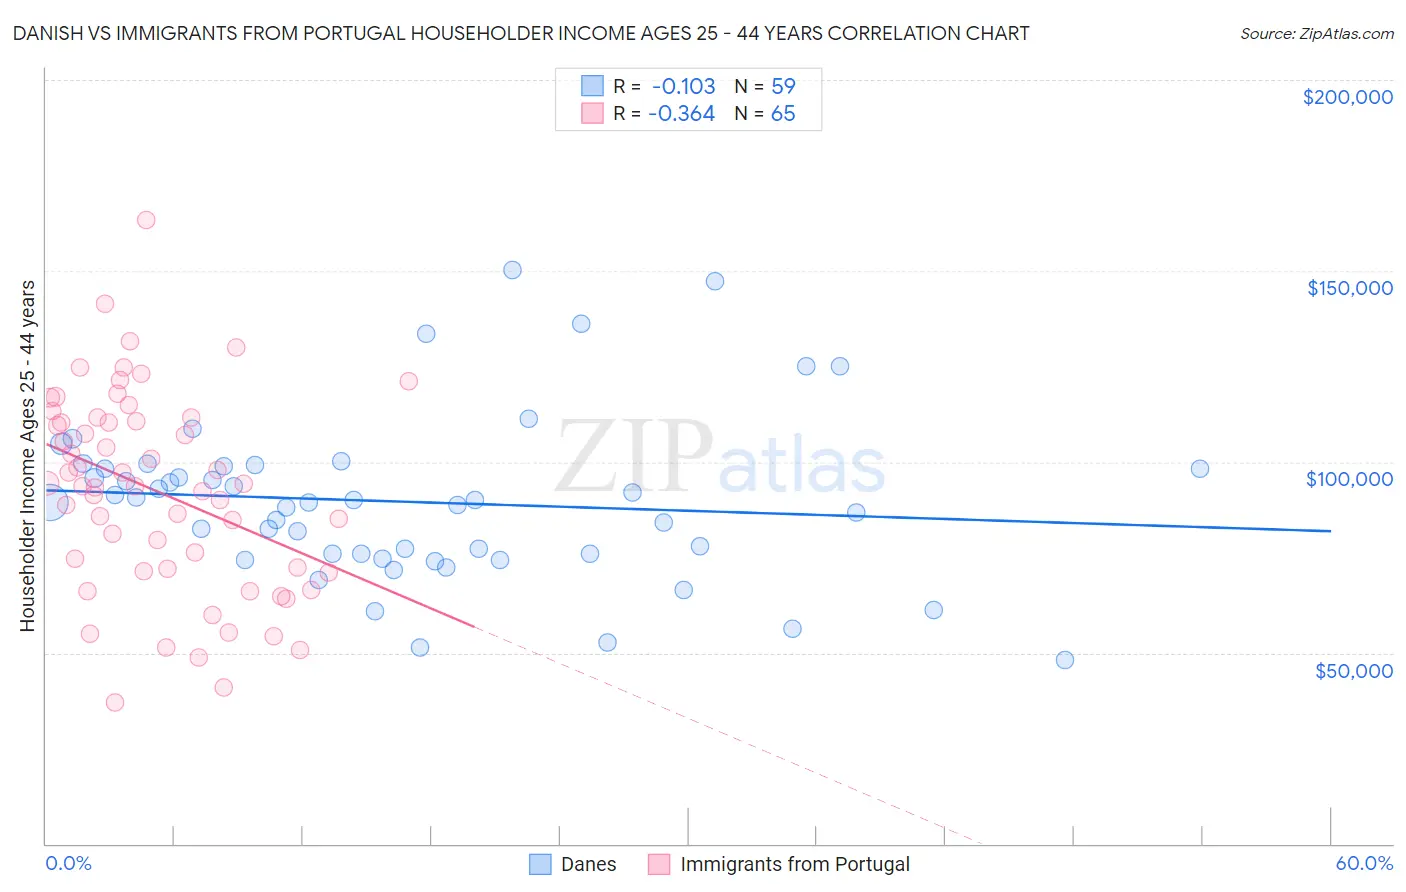
Danish vs Immigrants from Portugal Householder Income Ages 25 - 44 years Correlation Chart
The statistical analysis conducted on geographies consisting of 471,956,523 people shows a poor negative correlation between the proportion of Danes and household income with householder between the ages 25 and 44 in the United States with a correlation coefficient (R) of -0.103 and weighted average of $97,221. Similarly, the statistical analysis conducted on geographies consisting of 174,576,361 people shows a mild negative correlation between the proportion of Immigrants from Portugal and household income with householder between the ages 25 and 44 in the United States with a correlation coefficient (R) of -0.364 and weighted average of $95,512, a difference of 1.8%.
Householder Income Ages 25 - 44 years Correlation Summary
| Measurement | Danish | Immigrants from Portugal |
| Minimum | $48,125 | $36,913 |
| Maximum | $150,222 | $163,387 |
| Range | $102,097 | $126,474 |
| Mean | $89,539 | $92,248 |
| Median | $89,288 | $93,647 |
| Interquartile 25% (IQ1) | $75,783 | $71,683 |
| Interquartile 75% (IQ3) | $98,883 | $111,037 |
| Interquartile Range (IQR) | $23,100 | $39,354 |
| Standard Deviation (Sample) | $21,492 | $26,108 |
| Standard Deviation (Population) | $21,309 | $25,907 |
Demographics Similar to Danes and Immigrants from Portugal by Householder Income Ages 25 - 44 years
In terms of householder income ages 25 - 44 years, the demographic groups most similar to Danes are Luxembourger ($97,237, a difference of 0.020%), Immigrants from Jordan ($97,185, a difference of 0.040%), Immigrants from Chile ($97,159, a difference of 0.060%), Norwegian ($96,866, a difference of 0.37%), and Ethiopian ($96,824, a difference of 0.41%). Similarly, the demographic groups most similar to Immigrants from Portugal are Icelander ($95,560, a difference of 0.050%), Costa Rican ($95,565, a difference of 0.060%), Scandinavian ($95,596, a difference of 0.090%), Immigrants from Uganda ($95,698, a difference of 0.19%), and Immigrants from Germany ($95,913, a difference of 0.42%).
| Demographics | Rating | Rank | Householder Income Ages 25 - 44 years |
| Luxembourgers | 81.5 /100 | #141 | Excellent $97,237 |
| Danes | 81.3 /100 | #142 | Excellent $97,221 |
| Immigrants | Jordan | 81.0 /100 | #143 | Excellent $97,185 |
| Immigrants | Chile | 80.8 /100 | #144 | Excellent $97,159 |
| Norwegians | 78.2 /100 | #145 | Good $96,866 |
| Ethiopians | 77.8 /100 | #146 | Good $96,824 |
| Immigrants | Syria | 77.4 /100 | #147 | Good $96,789 |
| Irish | 76.9 /100 | #148 | Good $96,730 |
| Basques | 76.6 /100 | #149 | Good $96,709 |
| Ugandans | 76.2 /100 | #150 | Good $96,667 |
| Czechs | 74.8 /100 | #151 | Good $96,525 |
| South American Indians | 74.5 /100 | #152 | Good $96,497 |
| Slovenes | 73.9 /100 | #153 | Good $96,439 |
| Slavs | 73.2 /100 | #154 | Good $96,377 |
| Moroccans | 70.3 /100 | #155 | Good $96,117 |
| Immigrants | Germany | 67.9 /100 | #156 | Good $95,913 |
| Immigrants | Uganda | 65.2 /100 | #157 | Good $95,698 |
| Scandinavians | 63.9 /100 | #158 | Good $95,596 |
| Costa Ricans | 63.5 /100 | #159 | Good $95,565 |
| Icelanders | 63.4 /100 | #160 | Good $95,560 |
| Immigrants | Portugal | 62.8 /100 | #161 | Good $95,512 |