Immigrants from Ghana vs Pueblo Median Male Earnings
COMPARE
Immigrants from Ghana
Pueblo
Median Male Earnings
Median Male Earnings Comparison
Immigrants from Ghana
Pueblo
$51,836
MEDIAN MALE EARNINGS
6.9/ 100
METRIC RATING
219th/ 347
METRIC RANK
$41,314
MEDIAN MALE EARNINGS
0.0/ 100
METRIC RATING
344th/ 347
METRIC RANK
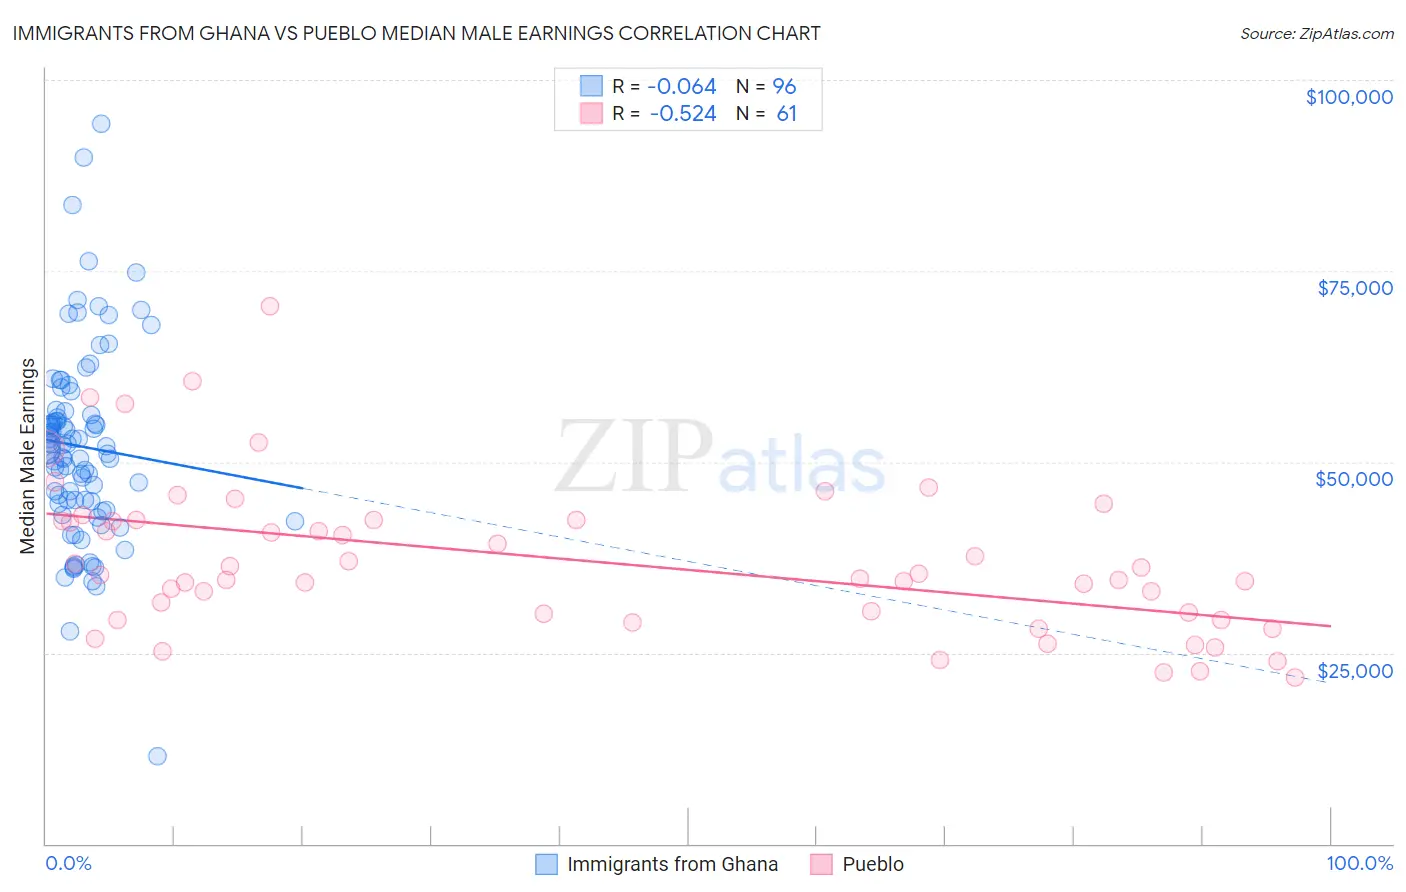
Immigrants from Ghana vs Pueblo Median Male Earnings Correlation Chart
The statistical analysis conducted on geographies consisting of 199,928,244 people shows a slight negative correlation between the proportion of Immigrants from Ghana and median male earnings in the United States with a correlation coefficient (R) of -0.064 and weighted average of $51,836. Similarly, the statistical analysis conducted on geographies consisting of 120,058,056 people shows a substantial negative correlation between the proportion of Pueblo and median male earnings in the United States with a correlation coefficient (R) of -0.524 and weighted average of $41,314, a difference of 25.5%.
Median Male Earnings Correlation Summary
| Measurement | Immigrants from Ghana | Pueblo |
| Minimum | $11,405 | $21,750 |
| Maximum | $94,205 | $70,357 |
| Range | $82,800 | $48,607 |
| Mean | $52,017 | $37,142 |
| Median | $51,835 | $35,266 |
| Interquartile 25% (IQ1) | $44,651 | $29,777 |
| Interquartile 75% (IQ3) | $56,389 | $42,334 |
| Interquartile Range (IQR) | $11,739 | $12,557 |
| Standard Deviation (Sample) | $12,685 | $9,968 |
| Standard Deviation (Population) | $12,619 | $9,886 |
Similar Demographics by Median Male Earnings
Demographics Similar to Immigrants from Ghana by Median Male Earnings
In terms of median male earnings, the demographic groups most similar to Immigrants from Ghana are Immigrants from Armenia ($51,793, a difference of 0.080%), Immigrants from Panama ($51,962, a difference of 0.24%), Immigrants from Senegal ($51,647, a difference of 0.37%), Immigrants from Bangladesh ($51,642, a difference of 0.38%), and Nigerian ($52,039, a difference of 0.39%).
| Demographics | Rating | Rank | Median Male Earnings |
| Cajuns | 10.7 /100 | #212 | Poor $52,325 |
| Native Hawaiians | 10.5 /100 | #213 | Poor $52,306 |
| Immigrants | Nonimmigrants | 9.3 /100 | #214 | Tragic $52,170 |
| Immigrants | Cameroon | 8.9 /100 | #215 | Tragic $52,119 |
| Immigrants | Venezuela | 8.3 /100 | #216 | Tragic $52,041 |
| Nigerians | 8.3 /100 | #217 | Tragic $52,039 |
| Immigrants | Panama | 7.7 /100 | #218 | Tragic $51,962 |
| Immigrants | Ghana | 6.9 /100 | #219 | Tragic $51,836 |
| Immigrants | Armenia | 6.6 /100 | #220 | Tragic $51,793 |
| Immigrants | Senegal | 5.8 /100 | #221 | Tragic $51,647 |
| Immigrants | Bangladesh | 5.8 /100 | #222 | Tragic $51,642 |
| Ecuadorians | 5.5 /100 | #223 | Tragic $51,596 |
| Immigrants | Cambodia | 5.5 /100 | #224 | Tragic $51,594 |
| Immigrants | Sudan | 5.0 /100 | #225 | Tragic $51,489 |
| Japanese | 4.9 /100 | #226 | Tragic $51,473 |
Demographics Similar to Pueblo by Median Male Earnings
In terms of median male earnings, the demographic groups most similar to Pueblo are Lumbee ($41,715, a difference of 0.97%), Arapaho ($41,758, a difference of 1.1%), Hopi ($42,060, a difference of 1.8%), Navajo ($42,098, a difference of 1.9%), and Pima ($42,357, a difference of 2.5%).
| Demographics | Rating | Rank | Median Male Earnings |
| Immigrants | Congo | 0.0 /100 | #333 | Tragic $44,204 |
| Immigrants | Yemen | 0.0 /100 | #334 | Tragic $44,083 |
| Spanish American Indians | 0.0 /100 | #335 | Tragic $44,010 |
| Immigrants | Cuba | 0.0 /100 | #336 | Tragic $43,461 |
| Menominee | 0.0 /100 | #337 | Tragic $42,581 |
| Crow | 0.0 /100 | #338 | Tragic $42,434 |
| Pima | 0.0 /100 | #339 | Tragic $42,357 |
| Navajo | 0.0 /100 | #340 | Tragic $42,098 |
| Hopi | 0.0 /100 | #341 | Tragic $42,060 |
| Arapaho | 0.0 /100 | #342 | Tragic $41,758 |
| Lumbee | 0.0 /100 | #343 | Tragic $41,715 |
| Pueblo | 0.0 /100 | #344 | Tragic $41,314 |
| Puerto Ricans | 0.0 /100 | #345 | Tragic $40,071 |
| Tohono O'odham | 0.0 /100 | #346 | Tragic $39,543 |
| Yup'ik | 0.0 /100 | #347 | Tragic $39,504 |