Immigrants from France vs Ute Householder Income Over 65 years
COMPARE
Immigrants from France
Ute
Householder Income Over 65 years
Householder Income Over 65 years Comparison
Immigrants from France
Ute
$66,826
HOUSEHOLDER INCOME OVER 65 YEARS
99.8/ 100
METRIC RATING
48th/ 347
METRIC RANK
$52,949
HOUSEHOLDER INCOME OVER 65 YEARS
0.0/ 100
METRIC RATING
304th/ 347
METRIC RANK
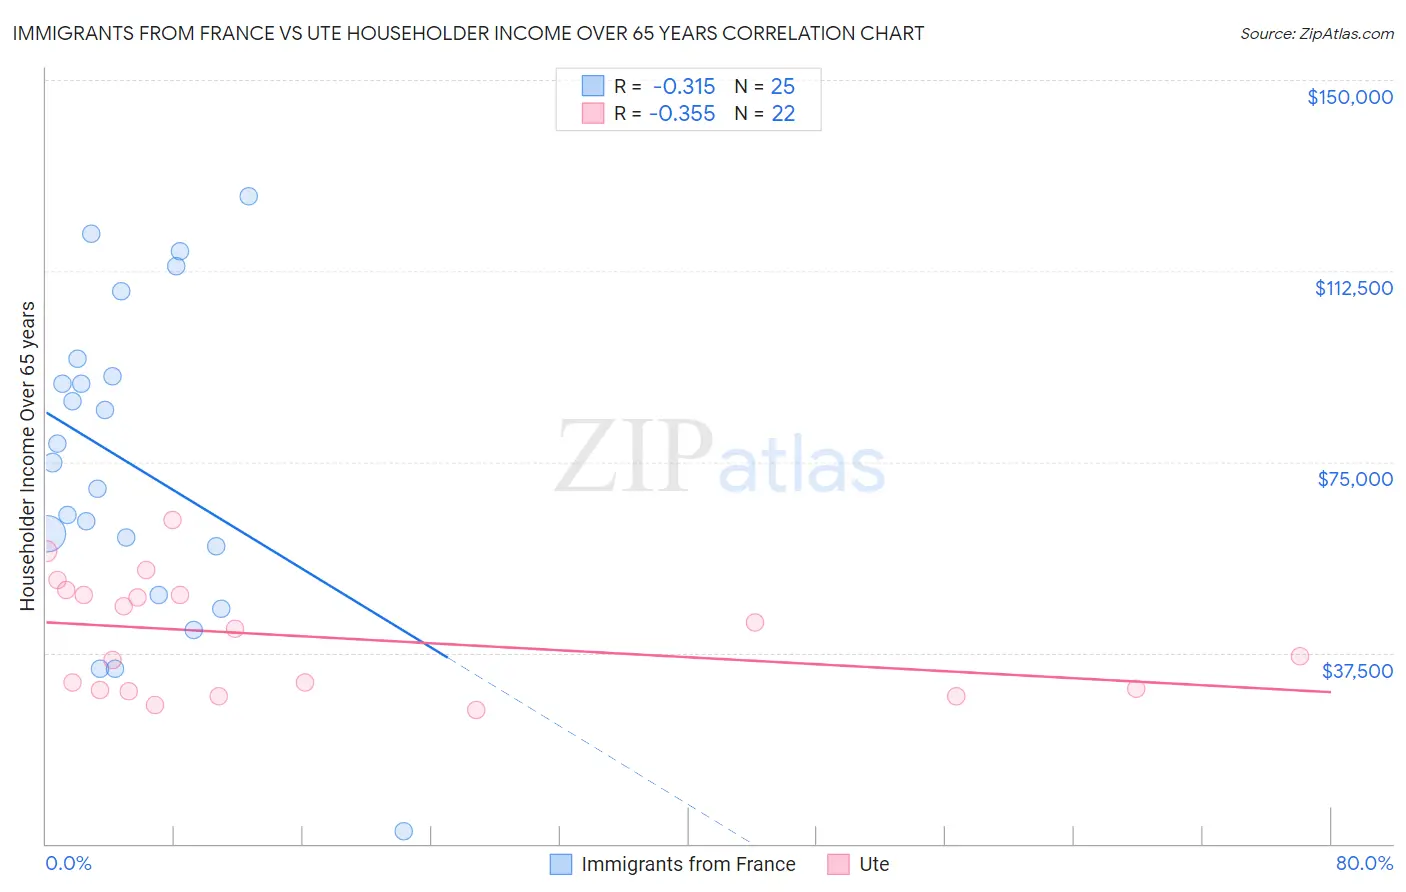
Immigrants from France vs Ute Householder Income Over 65 years Correlation Chart
The statistical analysis conducted on geographies consisting of 287,399,061 people shows a mild negative correlation between the proportion of Immigrants from France and household income with householder over the age of 65 in the United States with a correlation coefficient (R) of -0.315 and weighted average of $66,826. Similarly, the statistical analysis conducted on geographies consisting of 55,627,280 people shows a mild negative correlation between the proportion of Ute and household income with householder over the age of 65 in the United States with a correlation coefficient (R) of -0.355 and weighted average of $52,949, a difference of 26.2%.
Householder Income Over 65 years Correlation Summary
| Measurement | Immigrants from France | Ute |
| Minimum | $2,499 | $26,154 |
| Maximum | $127,250 | $63,482 |
| Range | $124,751 | $37,328 |
| Mean | $74,550 | $40,597 |
| Median | $74,828 | $39,530 |
| Interquartile 25% (IQ1) | $53,594 | $30,250 |
| Interquartile 75% (IQ3) | $93,532 | $48,922 |
| Interquartile Range (IQR) | $39,938 | $18,672 |
| Standard Deviation (Sample) | $30,676 | $11,138 |
| Standard Deviation (Population) | $30,056 | $10,882 |
Similar Demographics by Householder Income Over 65 years
Demographics Similar to Immigrants from France by Householder Income Over 65 years
In terms of householder income over 65 years, the demographic groups most similar to Immigrants from France are Cambodian ($66,892, a difference of 0.10%), Australian ($66,891, a difference of 0.10%), Immigrants from Indonesia ($66,694, a difference of 0.20%), Immigrants from Turkey ($66,672, a difference of 0.23%), and Immigrants from Afghanistan ($67,007, a difference of 0.27%).
| Demographics | Rating | Rank | Householder Income Over 65 years |
| Koreans | 99.9 /100 | #41 | Exceptional $67,472 |
| New Zealanders | 99.9 /100 | #42 | Exceptional $67,333 |
| Latvians | 99.9 /100 | #43 | Exceptional $67,326 |
| Immigrants | South Africa | 99.9 /100 | #44 | Exceptional $67,234 |
| Immigrants | Afghanistan | 99.8 /100 | #45 | Exceptional $67,007 |
| Cambodians | 99.8 /100 | #46 | Exceptional $66,892 |
| Australians | 99.8 /100 | #47 | Exceptional $66,891 |
| Immigrants | France | 99.8 /100 | #48 | Exceptional $66,826 |
| Immigrants | Indonesia | 99.8 /100 | #49 | Exceptional $66,694 |
| Immigrants | Turkey | 99.7 /100 | #50 | Exceptional $66,672 |
| Israelis | 99.7 /100 | #51 | Exceptional $66,636 |
| Immigrants | Scotland | 99.7 /100 | #52 | Exceptional $66,620 |
| Immigrants | Pakistan | 99.7 /100 | #53 | Exceptional $66,617 |
| Immigrants | Netherlands | 99.7 /100 | #54 | Exceptional $66,463 |
| Immigrants | Czechoslovakia | 99.7 /100 | #55 | Exceptional $66,376 |
Demographics Similar to Ute by Householder Income Over 65 years
In terms of householder income over 65 years, the demographic groups most similar to Ute are Pueblo ($52,930, a difference of 0.040%), Pennsylvania German ($52,888, a difference of 0.11%), Choctaw ($53,060, a difference of 0.21%), Hispanic or Latino ($52,832, a difference of 0.22%), and Spanish American Indian ($53,077, a difference of 0.24%).
| Demographics | Rating | Rank | Householder Income Over 65 years |
| Immigrants | Latin America | 0.0 /100 | #297 | Tragic $53,265 |
| Central American Indians | 0.0 /100 | #298 | Tragic $53,232 |
| Ottawa | 0.0 /100 | #299 | Tragic $53,217 |
| Immigrants | Bahamas | 0.0 /100 | #300 | Tragic $53,174 |
| Yuman | 0.0 /100 | #301 | Tragic $53,110 |
| Spanish American Indians | 0.0 /100 | #302 | Tragic $53,077 |
| Choctaw | 0.0 /100 | #303 | Tragic $53,060 |
| Ute | 0.0 /100 | #304 | Tragic $52,949 |
| Pueblo | 0.0 /100 | #305 | Tragic $52,930 |
| Pennsylvania Germans | 0.0 /100 | #306 | Tragic $52,888 |
| Hispanics or Latinos | 0.0 /100 | #307 | Tragic $52,832 |
| Immigrants | Mexico | 0.0 /100 | #308 | Tragic $52,801 |
| Hondurans | 0.0 /100 | #309 | Tragic $52,634 |
| Sioux | 0.0 /100 | #310 | Tragic $52,509 |
| Seminole | 0.0 /100 | #311 | Tragic $52,373 |