Immigrants from France vs Burmese Householder Income Over 65 years
COMPARE
Immigrants from France
Burmese
Householder Income Over 65 years
Householder Income Over 65 years Comparison
Immigrants from France
Burmese
$66,826
HOUSEHOLDER INCOME OVER 65 YEARS
99.8/ 100
METRIC RATING
48th/ 347
METRIC RANK
$71,139
HOUSEHOLDER INCOME OVER 65 YEARS
100.0/ 100
METRIC RATING
14th/ 347
METRIC RANK
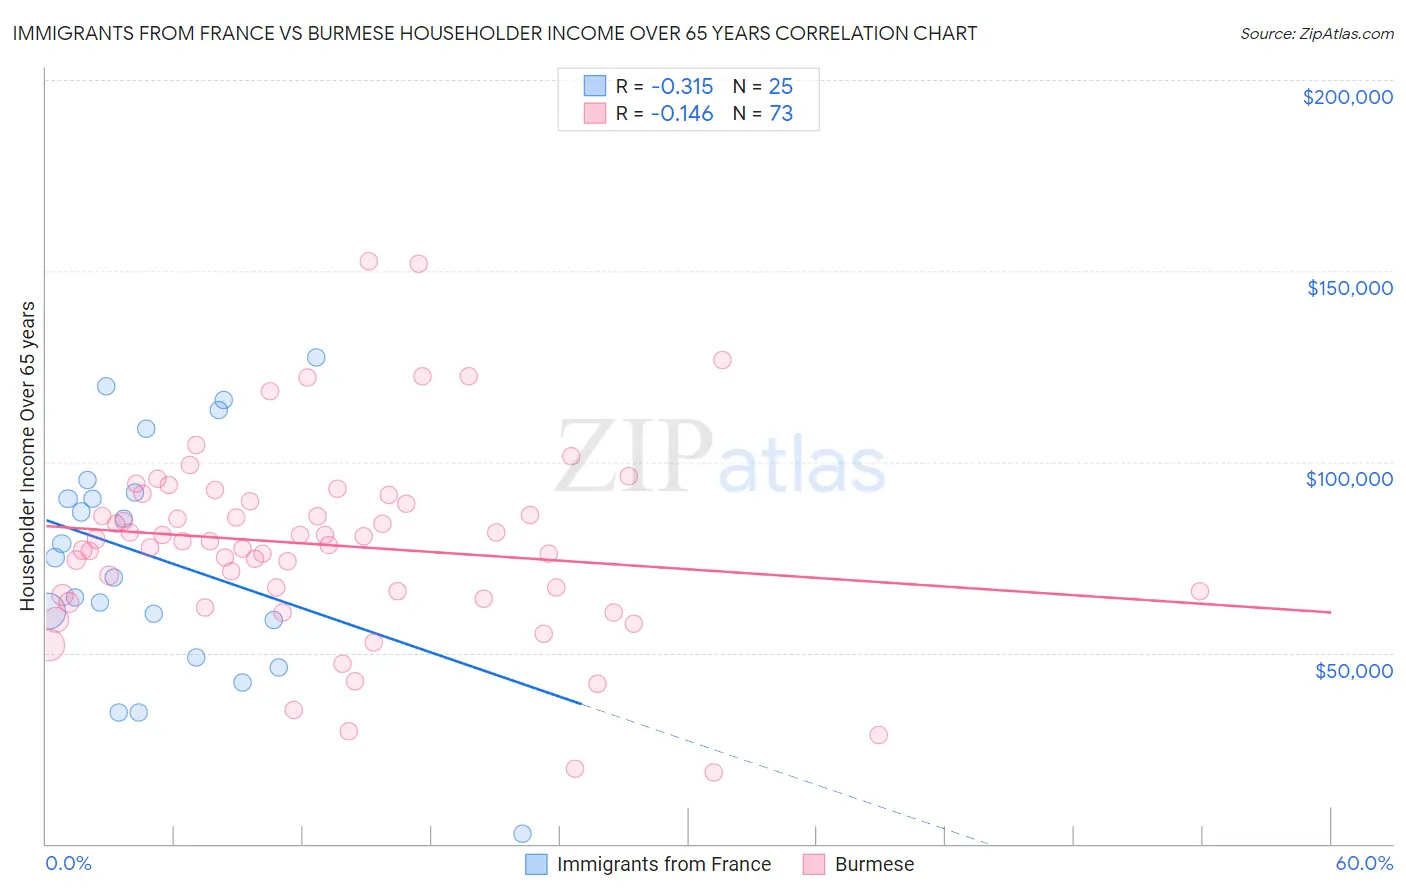
Immigrants from France vs Burmese Householder Income Over 65 years Correlation Chart
The statistical analysis conducted on geographies consisting of 287,399,061 people shows a mild negative correlation between the proportion of Immigrants from France and household income with householder over the age of 65 in the United States with a correlation coefficient (R) of -0.315 and weighted average of $66,826. Similarly, the statistical analysis conducted on geographies consisting of 462,915,415 people shows a poor negative correlation between the proportion of Burmese and household income with householder over the age of 65 in the United States with a correlation coefficient (R) of -0.146 and weighted average of $71,139, a difference of 6.5%.
Householder Income Over 65 years Correlation Summary
| Measurement | Immigrants from France | Burmese |
| Minimum | $2,499 | $18,720 |
| Maximum | $127,250 | $152,590 |
| Range | $124,751 | $133,870 |
| Mean | $74,550 | $78,265 |
| Median | $74,828 | $79,233 |
| Interquartile 25% (IQ1) | $53,594 | $64,619 |
| Interquartile 75% (IQ3) | $93,532 | $90,553 |
| Interquartile Range (IQR) | $39,938 | $25,934 |
| Standard Deviation (Sample) | $30,676 | $25,588 |
| Standard Deviation (Population) | $30,056 | $25,412 |
Similar Demographics by Householder Income Over 65 years
Demographics Similar to Immigrants from France by Householder Income Over 65 years
In terms of householder income over 65 years, the demographic groups most similar to Immigrants from France are Cambodian ($66,892, a difference of 0.10%), Australian ($66,891, a difference of 0.10%), Immigrants from Indonesia ($66,694, a difference of 0.20%), Immigrants from Turkey ($66,672, a difference of 0.23%), and Immigrants from Afghanistan ($67,007, a difference of 0.27%).
| Demographics | Rating | Rank | Householder Income Over 65 years |
| Koreans | 99.9 /100 | #41 | Exceptional $67,472 |
| New Zealanders | 99.9 /100 | #42 | Exceptional $67,333 |
| Latvians | 99.9 /100 | #43 | Exceptional $67,326 |
| Immigrants | South Africa | 99.9 /100 | #44 | Exceptional $67,234 |
| Immigrants | Afghanistan | 99.8 /100 | #45 | Exceptional $67,007 |
| Cambodians | 99.8 /100 | #46 | Exceptional $66,892 |
| Australians | 99.8 /100 | #47 | Exceptional $66,891 |
| Immigrants | France | 99.8 /100 | #48 | Exceptional $66,826 |
| Immigrants | Indonesia | 99.8 /100 | #49 | Exceptional $66,694 |
| Immigrants | Turkey | 99.7 /100 | #50 | Exceptional $66,672 |
| Israelis | 99.7 /100 | #51 | Exceptional $66,636 |
| Immigrants | Scotland | 99.7 /100 | #52 | Exceptional $66,620 |
| Immigrants | Pakistan | 99.7 /100 | #53 | Exceptional $66,617 |
| Immigrants | Netherlands | 99.7 /100 | #54 | Exceptional $66,463 |
| Immigrants | Czechoslovakia | 99.7 /100 | #55 | Exceptional $66,376 |
Demographics Similar to Burmese by Householder Income Over 65 years
In terms of householder income over 65 years, the demographic groups most similar to Burmese are Native Hawaiian ($71,021, a difference of 0.17%), Okinawan ($70,846, a difference of 0.41%), Immigrants from Hong Kong ($71,567, a difference of 0.60%), Immigrants from Korea ($70,696, a difference of 0.63%), and Cypriot ($71,714, a difference of 0.81%).
| Demographics | Rating | Rank | Householder Income Over 65 years |
| Immigrants | Bolivia | 100.0 /100 | #7 | Exceptional $73,434 |
| Immigrants | Singapore | 100.0 /100 | #8 | Exceptional $72,963 |
| Immigrants | India | 100.0 /100 | #9 | Exceptional $72,804 |
| Bhutanese | 100.0 /100 | #10 | Exceptional $72,288 |
| Thais | 100.0 /100 | #11 | Exceptional $72,099 |
| Cypriots | 100.0 /100 | #12 | Exceptional $71,714 |
| Immigrants | Hong Kong | 100.0 /100 | #13 | Exceptional $71,567 |
| Burmese | 100.0 /100 | #14 | Exceptional $71,139 |
| Native Hawaiians | 100.0 /100 | #15 | Exceptional $71,021 |
| Okinawans | 100.0 /100 | #16 | Exceptional $70,846 |
| Immigrants | Korea | 100.0 /100 | #17 | Exceptional $70,696 |
| Eastern Europeans | 100.0 /100 | #18 | Exceptional $70,470 |
| Indians (Asian) | 100.0 /100 | #19 | Exceptional $70,238 |
| Immigrants | South Central Asia | 100.0 /100 | #20 | Exceptional $70,103 |
| Immigrants | Eastern Asia | 100.0 /100 | #21 | Exceptional $69,872 |