Immigrants from Iran vs Ute Householder Income Over 65 years
COMPARE
Immigrants from Iran
Ute
Householder Income Over 65 years
Householder Income Over 65 years Comparison
Immigrants from Iran
Ute
$75,081
HOUSEHOLDER INCOME OVER 65 YEARS
100.0/ 100
METRIC RATING
5th/ 347
METRIC RANK
$52,949
HOUSEHOLDER INCOME OVER 65 YEARS
0.0/ 100
METRIC RATING
304th/ 347
METRIC RANK
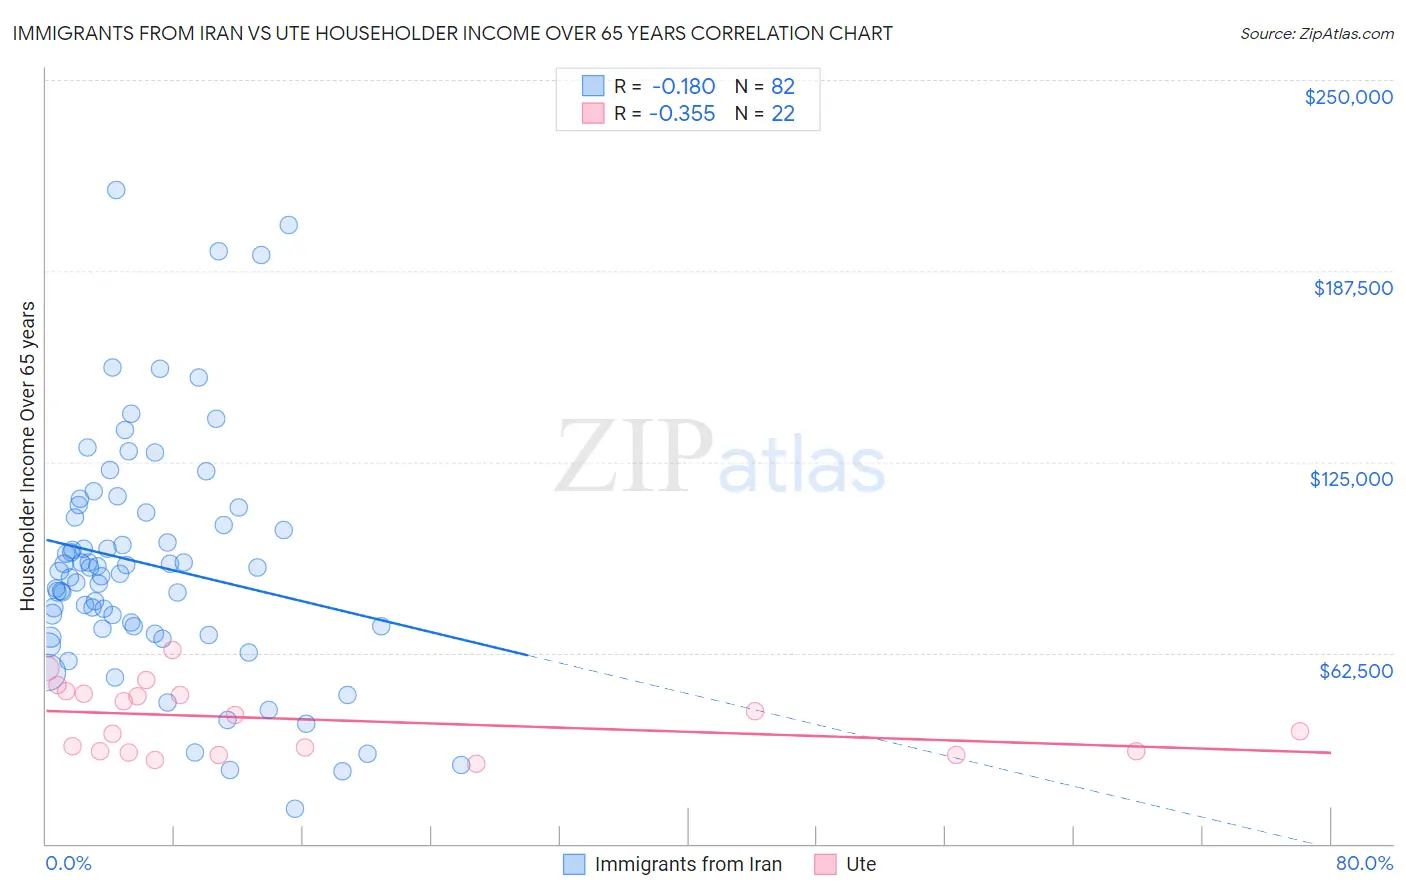
Immigrants from Iran vs Ute Householder Income Over 65 years Correlation Chart
The statistical analysis conducted on geographies consisting of 279,536,688 people shows a poor negative correlation between the proportion of Immigrants from Iran and household income with householder over the age of 65 in the United States with a correlation coefficient (R) of -0.180 and weighted average of $75,081. Similarly, the statistical analysis conducted on geographies consisting of 55,627,280 people shows a mild negative correlation between the proportion of Ute and household income with householder over the age of 65 in the United States with a correlation coefficient (R) of -0.355 and weighted average of $52,949, a difference of 41.8%.
Householder Income Over 65 years Correlation Summary
| Measurement | Immigrants from Iran | Ute |
| Minimum | $11,563 | $26,154 |
| Maximum | $214,063 | $63,482 |
| Range | $202,500 | $37,328 |
| Mean | $91,354 | $40,597 |
| Median | $88,665 | $39,530 |
| Interquartile 25% (IQ1) | $70,285 | $30,250 |
| Interquartile 75% (IQ3) | $108,269 | $48,922 |
| Interquartile Range (IQR) | $37,985 | $18,672 |
| Standard Deviation (Sample) | $39,442 | $11,138 |
| Standard Deviation (Population) | $39,201 | $10,882 |
Similar Demographics by Householder Income Over 65 years
Demographics Similar to Immigrants from Iran by Householder Income Over 65 years
In terms of householder income over 65 years, the demographic groups most similar to Immigrants from Iran are Bolivian ($74,245, a difference of 1.1%), Filipino ($76,686, a difference of 2.1%), Immigrants from Bolivia ($73,434, a difference of 2.2%), Immigrants from Taiwan ($77,051, a difference of 2.6%), and Immigrants from Singapore ($72,963, a difference of 2.9%).
| Demographics | Rating | Rank | Householder Income Over 65 years |
| Chinese | 100.0 /100 | #1 | Exceptional $77,465 |
| Iranians | 100.0 /100 | #2 | Exceptional $77,429 |
| Immigrants | Taiwan | 100.0 /100 | #3 | Exceptional $77,051 |
| Filipinos | 100.0 /100 | #4 | Exceptional $76,686 |
| Immigrants | Iran | 100.0 /100 | #5 | Exceptional $75,081 |
| Bolivians | 100.0 /100 | #6 | Exceptional $74,245 |
| Immigrants | Bolivia | 100.0 /100 | #7 | Exceptional $73,434 |
| Immigrants | Singapore | 100.0 /100 | #8 | Exceptional $72,963 |
| Immigrants | India | 100.0 /100 | #9 | Exceptional $72,804 |
| Bhutanese | 100.0 /100 | #10 | Exceptional $72,288 |
| Thais | 100.0 /100 | #11 | Exceptional $72,099 |
| Cypriots | 100.0 /100 | #12 | Exceptional $71,714 |
| Immigrants | Hong Kong | 100.0 /100 | #13 | Exceptional $71,567 |
| Burmese | 100.0 /100 | #14 | Exceptional $71,139 |
| Native Hawaiians | 100.0 /100 | #15 | Exceptional $71,021 |
Demographics Similar to Ute by Householder Income Over 65 years
In terms of householder income over 65 years, the demographic groups most similar to Ute are Pueblo ($52,930, a difference of 0.040%), Pennsylvania German ($52,888, a difference of 0.11%), Choctaw ($53,060, a difference of 0.21%), Hispanic or Latino ($52,832, a difference of 0.22%), and Spanish American Indian ($53,077, a difference of 0.24%).
| Demographics | Rating | Rank | Householder Income Over 65 years |
| Immigrants | Latin America | 0.0 /100 | #297 | Tragic $53,265 |
| Central American Indians | 0.0 /100 | #298 | Tragic $53,232 |
| Ottawa | 0.0 /100 | #299 | Tragic $53,217 |
| Immigrants | Bahamas | 0.0 /100 | #300 | Tragic $53,174 |
| Yuman | 0.0 /100 | #301 | Tragic $53,110 |
| Spanish American Indians | 0.0 /100 | #302 | Tragic $53,077 |
| Choctaw | 0.0 /100 | #303 | Tragic $53,060 |
| Ute | 0.0 /100 | #304 | Tragic $52,949 |
| Pueblo | 0.0 /100 | #305 | Tragic $52,930 |
| Pennsylvania Germans | 0.0 /100 | #306 | Tragic $52,888 |
| Hispanics or Latinos | 0.0 /100 | #307 | Tragic $52,832 |
| Immigrants | Mexico | 0.0 /100 | #308 | Tragic $52,801 |
| Hondurans | 0.0 /100 | #309 | Tragic $52,634 |
| Sioux | 0.0 /100 | #310 | Tragic $52,509 |
| Seminole | 0.0 /100 | #311 | Tragic $52,373 |