Immigrants from Fiji vs Immigrants from Japan Householder Income Ages 45 - 64 years
COMPARE
Immigrants from Fiji
Immigrants from Japan
Householder Income Ages 45 - 64 years
Householder Income Ages 45 - 64 years Comparison
Immigrants from Fiji
Immigrants from Japan
$106,952
HOUSEHOLDER INCOME AGES 45 - 64 YEARS
96.5/ 100
METRIC RATING
107th/ 347
METRIC RANK
$118,498
HOUSEHOLDER INCOME AGES 45 - 64 YEARS
100.0/ 100
METRIC RATING
24th/ 347
METRIC RANK
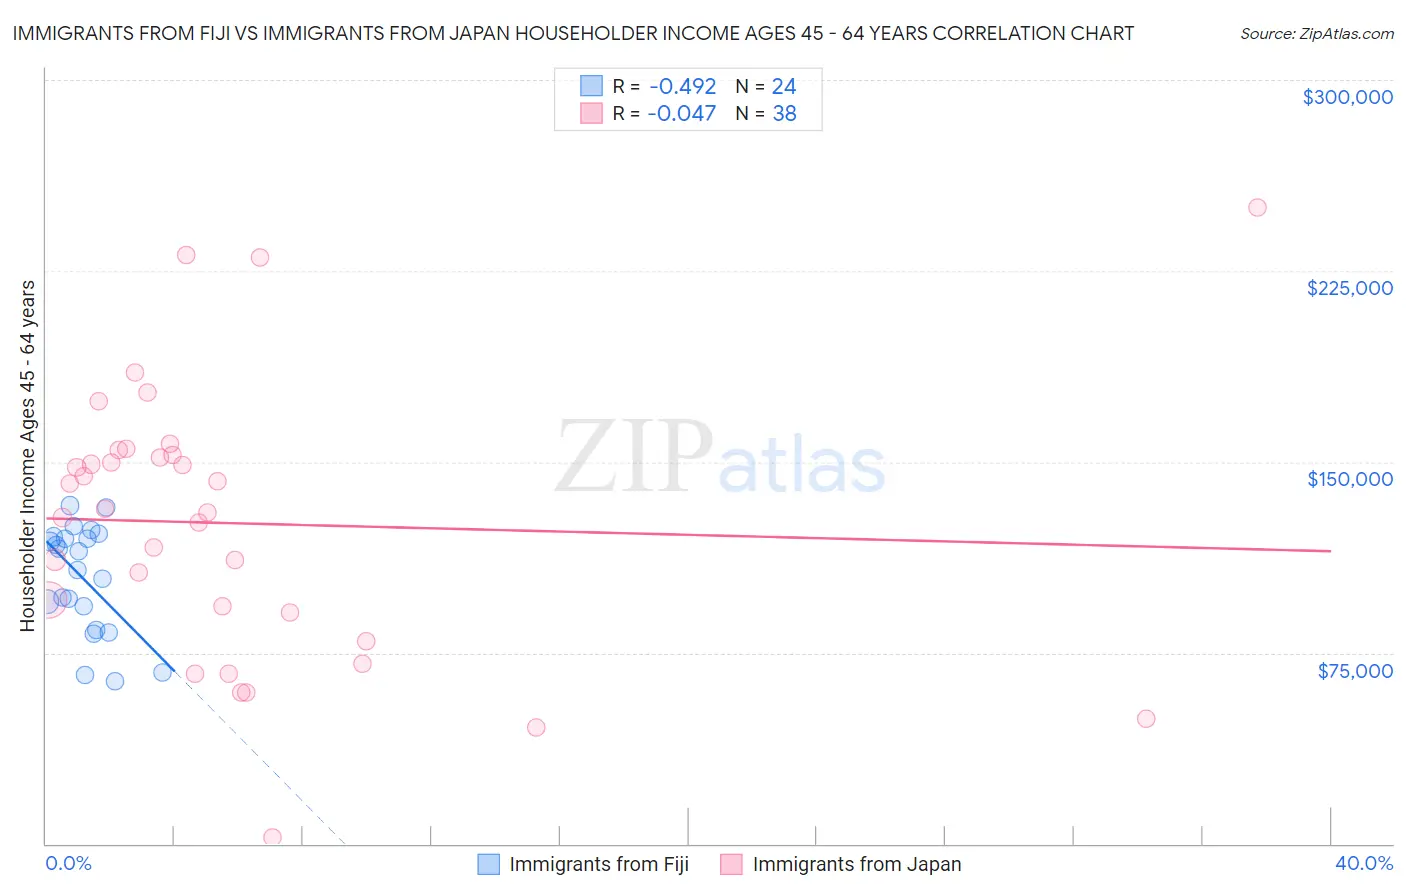
Immigrants from Fiji vs Immigrants from Japan Householder Income Ages 45 - 64 years Correlation Chart
The statistical analysis conducted on geographies consisting of 93,744,178 people shows a moderate negative correlation between the proportion of Immigrants from Fiji and household income with householder between the ages 45 and 64 in the United States with a correlation coefficient (R) of -0.492 and weighted average of $106,952. Similarly, the statistical analysis conducted on geographies consisting of 339,668,461 people shows no correlation between the proportion of Immigrants from Japan and household income with householder between the ages 45 and 64 in the United States with a correlation coefficient (R) of -0.047 and weighted average of $118,498, a difference of 10.8%.
Householder Income Ages 45 - 64 years Correlation Summary
| Measurement | Immigrants from Fiji | Immigrants from Japan |
| Minimum | $63,895 | $2,499 |
| Maximum | $132,819 | $250,001 |
| Range | $68,924 | $247,502 |
| Mean | $104,214 | $125,900 |
| Median | $111,173 | $130,922 |
| Interquartile 25% (IQ1) | $88,582 | $90,857 |
| Interquartile 75% (IQ3) | $120,299 | $152,701 |
| Interquartile Range (IQR) | $31,717 | $61,844 |
| Standard Deviation (Sample) | $21,039 | $53,396 |
| Standard Deviation (Population) | $20,596 | $52,689 |
Similar Demographics by Householder Income Ages 45 - 64 years
Demographics Similar to Immigrants from Fiji by Householder Income Ages 45 - 64 years
In terms of householder income ages 45 - 64 years, the demographic groups most similar to Immigrants from Fiji are Armenian ($107,002, a difference of 0.050%), Zimbabwean ($106,849, a difference of 0.10%), Macedonian ($107,074, a difference of 0.11%), Immigrants from Ukraine ($107,079, a difference of 0.12%), and Syrian ($107,207, a difference of 0.24%).
| Demographics | Rating | Rank | Householder Income Ages 45 - 64 years |
| Immigrants | Serbia | 97.4 /100 | #100 | Exceptional $107,569 |
| Immigrants | Kazakhstan | 97.2 /100 | #101 | Exceptional $107,378 |
| Immigrants | Moldova | 97.1 /100 | #102 | Exceptional $107,357 |
| Syrians | 96.9 /100 | #103 | Exceptional $107,207 |
| Immigrants | Ukraine | 96.7 /100 | #104 | Exceptional $107,079 |
| Macedonians | 96.7 /100 | #105 | Exceptional $107,074 |
| Armenians | 96.6 /100 | #106 | Exceptional $107,002 |
| Immigrants | Fiji | 96.5 /100 | #107 | Exceptional $106,952 |
| Zimbabweans | 96.3 /100 | #108 | Exceptional $106,849 |
| Chileans | 95.9 /100 | #109 | Exceptional $106,611 |
| Immigrants | Brazil | 95.6 /100 | #110 | Exceptional $106,470 |
| Immigrants | Vietnam | 95.5 /100 | #111 | Exceptional $106,417 |
| Swedes | 95.4 /100 | #112 | Exceptional $106,377 |
| Europeans | 95.4 /100 | #113 | Exceptional $106,367 |
| Immigrants | Poland | 95.3 /100 | #114 | Exceptional $106,319 |
Demographics Similar to Immigrants from Japan by Householder Income Ages 45 - 64 years
In terms of householder income ages 45 - 64 years, the demographic groups most similar to Immigrants from Japan are Asian ($118,426, a difference of 0.060%), Immigrants from Sweden ($118,318, a difference of 0.15%), Bolivian ($118,871, a difference of 0.32%), Immigrants from Belgium ($118,932, a difference of 0.37%), and Immigrants from Northern Europe ($117,930, a difference of 0.48%).
| Demographics | Rating | Rank | Householder Income Ages 45 - 64 years |
| Burmese | 100.0 /100 | #17 | Exceptional $121,444 |
| Immigrants | Korea | 100.0 /100 | #18 | Exceptional $121,243 |
| Eastern Europeans | 100.0 /100 | #19 | Exceptional $120,684 |
| Immigrants | Australia | 100.0 /100 | #20 | Exceptional $119,308 |
| Immigrants | Sri Lanka | 100.0 /100 | #21 | Exceptional $119,094 |
| Immigrants | Belgium | 100.0 /100 | #22 | Exceptional $118,932 |
| Bolivians | 100.0 /100 | #23 | Exceptional $118,871 |
| Immigrants | Japan | 100.0 /100 | #24 | Exceptional $118,498 |
| Asians | 100.0 /100 | #25 | Exceptional $118,426 |
| Immigrants | Sweden | 100.0 /100 | #26 | Exceptional $118,318 |
| Immigrants | Northern Europe | 100.0 /100 | #27 | Exceptional $117,930 |
| Turks | 100.0 /100 | #28 | Exceptional $117,814 |
| Bhutanese | 100.0 /100 | #29 | Exceptional $117,750 |
| Immigrants | Bolivia | 100.0 /100 | #30 | Exceptional $117,731 |
| Immigrants | Asia | 100.0 /100 | #31 | Exceptional $116,566 |