Immigrants from Europe vs Immigrants from South America Median Male Earnings
COMPARE
Immigrants from Europe
Immigrants from South America
Median Male Earnings
Median Male Earnings Comparison
Immigrants from Europe
Immigrants from South America
$62,057
MEDIAN MALE EARNINGS
99.9/ 100
METRIC RATING
49th/ 347
METRIC RANK
$53,962
MEDIAN MALE EARNINGS
37.3/ 100
METRIC RATING
183rd/ 347
METRIC RANK
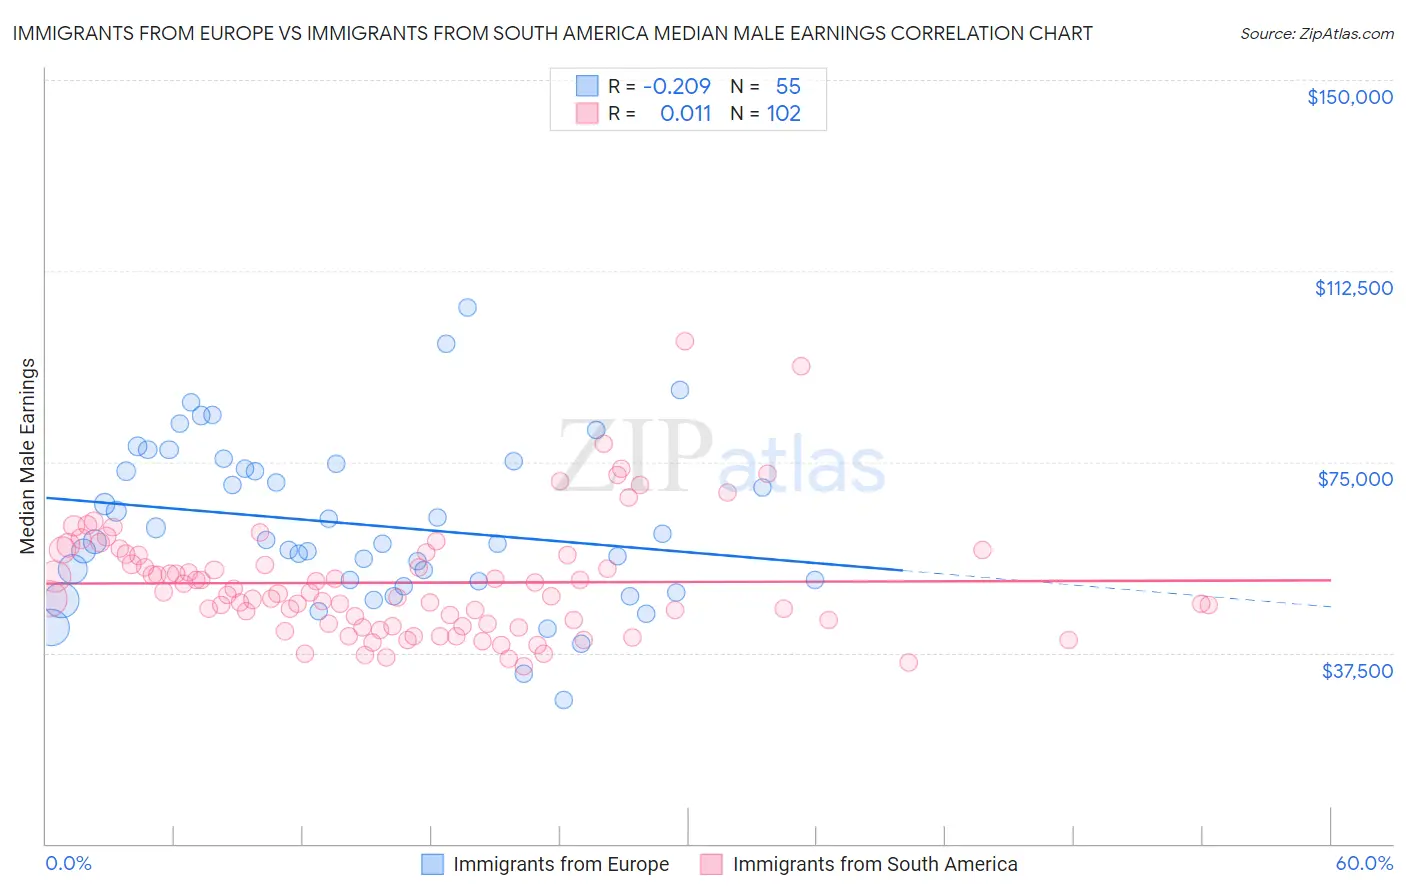
Immigrants from Europe vs Immigrants from South America Median Male Earnings Correlation Chart
The statistical analysis conducted on geographies consisting of 546,673,847 people shows a weak negative correlation between the proportion of Immigrants from Europe and median male earnings in the United States with a correlation coefficient (R) of -0.209 and weighted average of $62,057. Similarly, the statistical analysis conducted on geographies consisting of 486,116,321 people shows no correlation between the proportion of Immigrants from South America and median male earnings in the United States with a correlation coefficient (R) of 0.011 and weighted average of $53,962, a difference of 15.0%.
Median Male Earnings Correlation Summary
| Measurement | Immigrants from Europe | Immigrants from South America |
| Minimum | $28,125 | $34,825 |
| Maximum | $105,302 | $98,656 |
| Range | $77,177 | $63,831 |
| Mean | $62,740 | $51,267 |
| Median | $59,324 | $48,941 |
| Interquartile 25% (IQ1) | $51,620 | $43,131 |
| Interquartile 75% (IQ3) | $74,675 | $56,719 |
| Interquartile Range (IQR) | $23,055 | $13,589 |
| Standard Deviation (Sample) | $15,923 | $11,368 |
| Standard Deviation (Population) | $15,777 | $11,312 |
Similar Demographics by Median Male Earnings
Demographics Similar to Immigrants from Europe by Median Male Earnings
In terms of median male earnings, the demographic groups most similar to Immigrants from Europe are Immigrants from Malaysia ($62,121, a difference of 0.10%), Immigrants from Austria ($62,164, a difference of 0.17%), Immigrants from Czechoslovakia ($62,217, a difference of 0.26%), Bhutanese ($61,759, a difference of 0.48%), and Bulgarian ($62,378, a difference of 0.52%).
| Demographics | Rating | Rank | Median Male Earnings |
| Immigrants | Greece | 100.0 /100 | #42 | Exceptional $62,689 |
| Immigrants | Belarus | 100.0 /100 | #43 | Exceptional $62,658 |
| Cambodians | 100.0 /100 | #44 | Exceptional $62,516 |
| Bulgarians | 100.0 /100 | #45 | Exceptional $62,378 |
| Immigrants | Czechoslovakia | 99.9 /100 | #46 | Exceptional $62,217 |
| Immigrants | Austria | 99.9 /100 | #47 | Exceptional $62,164 |
| Immigrants | Malaysia | 99.9 /100 | #48 | Exceptional $62,121 |
| Immigrants | Europe | 99.9 /100 | #49 | Exceptional $62,057 |
| Bhutanese | 99.9 /100 | #50 | Exceptional $61,759 |
| Estonians | 99.9 /100 | #51 | Exceptional $61,710 |
| Immigrants | Norway | 99.9 /100 | #52 | Exceptional $61,628 |
| South Africans | 99.9 /100 | #53 | Exceptional $61,460 |
| Immigrants | Latvia | 99.9 /100 | #54 | Exceptional $61,422 |
| Greeks | 99.9 /100 | #55 | Exceptional $61,242 |
| Lithuanians | 99.9 /100 | #56 | Exceptional $61,228 |
Demographics Similar to Immigrants from South America by Median Male Earnings
In terms of median male earnings, the demographic groups most similar to Immigrants from South America are Yugoslavian ($53,967, a difference of 0.010%), White/Caucasian ($53,925, a difference of 0.070%), Immigrants from Sierra Leone ($53,905, a difference of 0.11%), Colombian ($53,832, a difference of 0.24%), and Immigrants ($54,168, a difference of 0.38%).
| Demographics | Rating | Rank | Median Male Earnings |
| Spaniards | 47.8 /100 | #176 | Average $54,401 |
| Costa Ricans | 44.8 /100 | #177 | Average $54,279 |
| Sierra Leoneans | 44.8 /100 | #178 | Average $54,279 |
| Celtics | 43.9 /100 | #179 | Average $54,242 |
| Iraqis | 42.5 /100 | #180 | Average $54,182 |
| Immigrants | Immigrants | 42.1 /100 | #181 | Average $54,168 |
| Yugoslavians | 37.4 /100 | #182 | Fair $53,967 |
| Immigrants | South America | 37.3 /100 | #183 | Fair $53,962 |
| Whites/Caucasians | 36.5 /100 | #184 | Fair $53,925 |
| Immigrants | Sierra Leone | 36.0 /100 | #185 | Fair $53,905 |
| Colombians | 34.4 /100 | #186 | Fair $53,832 |
| Immigrants | Eritrea | 31.8 /100 | #187 | Fair $53,715 |
| Immigrants | Eastern Africa | 31.8 /100 | #188 | Fair $53,713 |
| Puget Sound Salish | 31.6 /100 | #189 | Fair $53,704 |
| Uruguayans | 31.1 /100 | #190 | Fair $53,680 |