Immigrants from Eritrea vs Immigrants from Venezuela Householder Income Ages 25 - 44 years
COMPARE
Immigrants from Eritrea
Immigrants from Venezuela
Householder Income Ages 25 - 44 years
Householder Income Ages 25 - 44 years Comparison
Immigrants from Eritrea
Immigrants from Venezuela
$93,466
HOUSEHOLDER INCOME AGES 25 - 44 YEARS
35.2/ 100
METRIC RATING
185th/ 347
METRIC RANK
$87,038
HOUSEHOLDER INCOME AGES 25 - 44 YEARS
1.5/ 100
METRIC RATING
244th/ 347
METRIC RANK
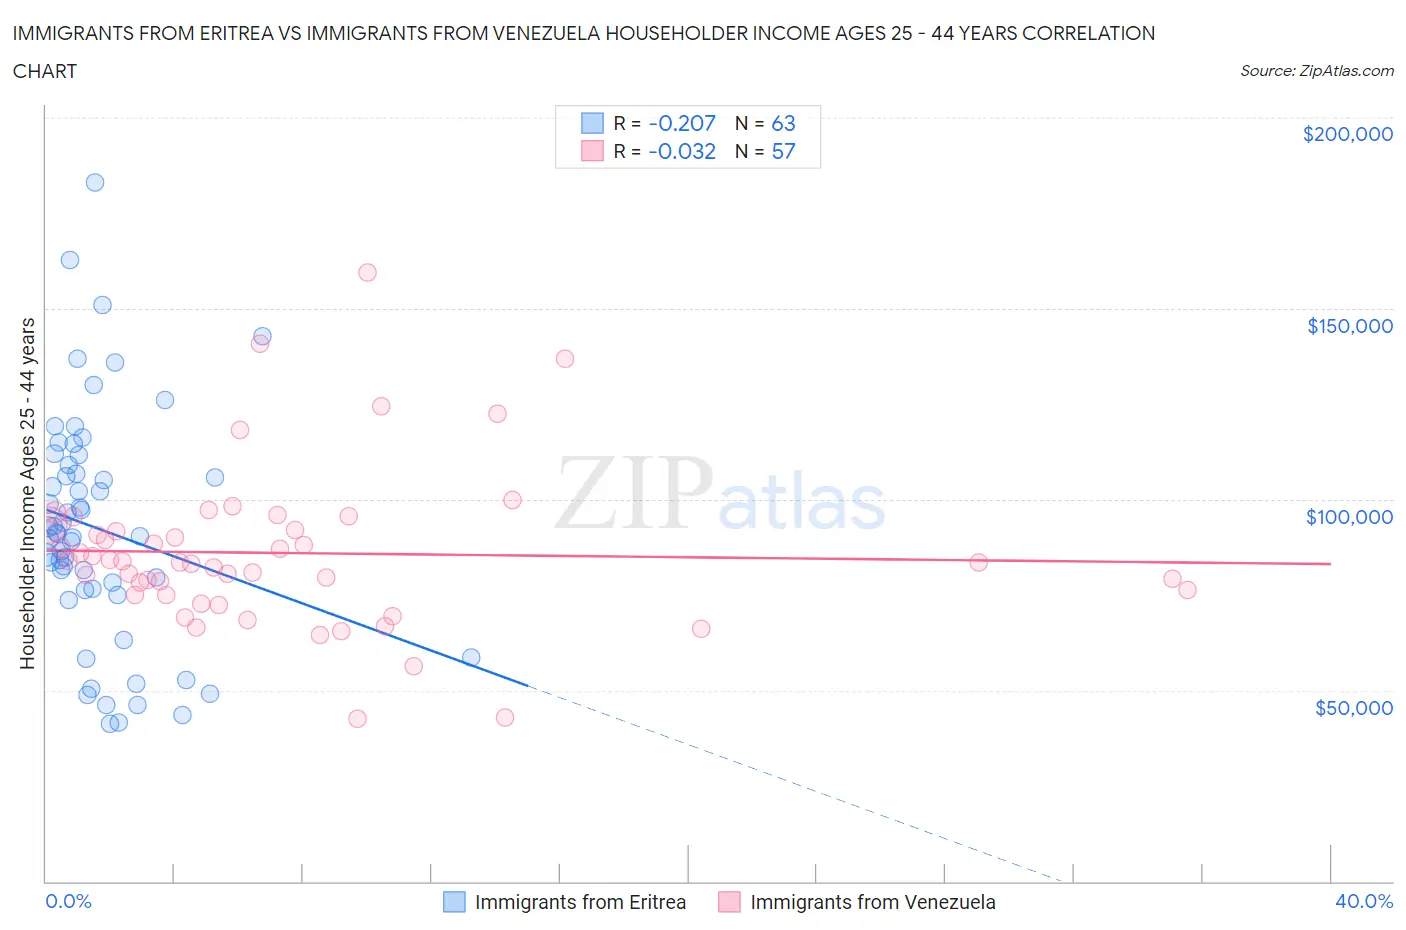
Immigrants from Eritrea vs Immigrants from Venezuela Householder Income Ages 25 - 44 years Correlation Chart
The statistical analysis conducted on geographies consisting of 104,828,872 people shows a weak negative correlation between the proportion of Immigrants from Eritrea and household income with householder between the ages 25 and 44 in the United States with a correlation coefficient (R) of -0.207 and weighted average of $93,466. Similarly, the statistical analysis conducted on geographies consisting of 287,593,793 people shows no correlation between the proportion of Immigrants from Venezuela and household income with householder between the ages 25 and 44 in the United States with a correlation coefficient (R) of -0.032 and weighted average of $87,038, a difference of 7.4%.
Householder Income Ages 25 - 44 years Correlation Summary
| Measurement | Immigrants from Eritrea | Immigrants from Venezuela |
| Minimum | $41,395 | $42,682 |
| Maximum | $183,112 | $159,302 |
| Range | $141,717 | $116,620 |
| Mean | $92,198 | $85,948 |
| Median | $91,003 | $83,506 |
| Interquartile 25% (IQ1) | $76,431 | $74,951 |
| Interquartile 75% (IQ3) | $109,130 | $92,632 |
| Interquartile Range (IQR) | $32,699 | $17,681 |
| Standard Deviation (Sample) | $30,253 | $20,900 |
| Standard Deviation (Population) | $30,012 | $20,716 |
Similar Demographics by Householder Income Ages 25 - 44 years
Demographics Similar to Immigrants from Eritrea by Householder Income Ages 25 - 44 years
In terms of householder income ages 25 - 44 years, the demographic groups most similar to Immigrants from Eritrea are Sierra Leonean ($93,435, a difference of 0.030%), German ($93,531, a difference of 0.070%), Guamanian/Chamorro ($93,569, a difference of 0.11%), Spaniard ($93,366, a difference of 0.11%), and Uruguayan ($93,631, a difference of 0.18%).
| Demographics | Rating | Rank | Householder Income Ages 25 - 44 years |
| Immigrants | South America | 42.8 /100 | #178 | Average $94,042 |
| French Canadians | 38.2 /100 | #179 | Fair $93,694 |
| French | 37.8 /100 | #180 | Fair $93,665 |
| Puget Sound Salish | 37.7 /100 | #181 | Fair $93,661 |
| Uruguayans | 37.3 /100 | #182 | Fair $93,631 |
| Guamanians/Chamorros | 36.5 /100 | #183 | Fair $93,569 |
| Germans | 36.0 /100 | #184 | Fair $93,531 |
| Immigrants | Eritrea | 35.2 /100 | #185 | Fair $93,466 |
| Sierra Leoneans | 34.8 /100 | #186 | Fair $93,435 |
| Spaniards | 34.0 /100 | #187 | Fair $93,366 |
| Immigrants | Sierra Leone | 30.9 /100 | #188 | Fair $93,115 |
| Dutch | 30.5 /100 | #189 | Fair $93,081 |
| Welsh | 30.0 /100 | #190 | Fair $93,039 |
| Tlingit-Haida | 29.4 /100 | #191 | Fair $92,987 |
| Immigrants | Costa Rica | 28.2 /100 | #192 | Fair $92,876 |
Demographics Similar to Immigrants from Venezuela by Householder Income Ages 25 - 44 years
In terms of householder income ages 25 - 44 years, the demographic groups most similar to Immigrants from Venezuela are Immigrants from West Indies ($87,063, a difference of 0.030%), Immigrants from El Salvador ($86,913, a difference of 0.14%), West Indian ($87,205, a difference of 0.19%), Immigrants from Burma/Myanmar ($86,736, a difference of 0.35%), and Immigrants from Nigeria ($86,589, a difference of 0.52%).
| Demographics | Rating | Rank | Householder Income Ages 25 - 44 years |
| Salvadorans | 2.8 /100 | #237 | Tragic $88,198 |
| Alaska Natives | 2.6 /100 | #238 | Tragic $88,018 |
| Immigrants | Ghana | 2.2 /100 | #239 | Tragic $87,760 |
| Nicaraguans | 2.2 /100 | #240 | Tragic $87,751 |
| Nigerians | 2.2 /100 | #241 | Tragic $87,730 |
| West Indians | 1.7 /100 | #242 | Tragic $87,205 |
| Immigrants | West Indies | 1.5 /100 | #243 | Tragic $87,063 |
| Immigrants | Venezuela | 1.5 /100 | #244 | Tragic $87,038 |
| Immigrants | El Salvador | 1.4 /100 | #245 | Tragic $86,913 |
| Immigrants | Burma/Myanmar | 1.3 /100 | #246 | Tragic $86,736 |
| Immigrants | Nigeria | 1.2 /100 | #247 | Tragic $86,589 |
| Immigrants | Sudan | 0.9 /100 | #248 | Tragic $86,109 |
| French American Indians | 0.8 /100 | #249 | Tragic $85,899 |
| Pennsylvania Germans | 0.8 /100 | #250 | Tragic $85,836 |
| Cape Verdeans | 0.8 /100 | #251 | Tragic $85,758 |