Immigrants from England vs Northern European Householder Income Ages 25 - 44 years
COMPARE
Immigrants from England
Northern European
Householder Income Ages 25 - 44 years
Householder Income Ages 25 - 44 years Comparison
Immigrants from England
Northern Europeans
$102,020
HOUSEHOLDER INCOME AGES 25 - 44 YEARS
98.4/ 100
METRIC RATING
93rd/ 347
METRIC RANK
$100,457
HOUSEHOLDER INCOME AGES 25 - 44 YEARS
96.3/ 100
METRIC RATING
107th/ 347
METRIC RANK
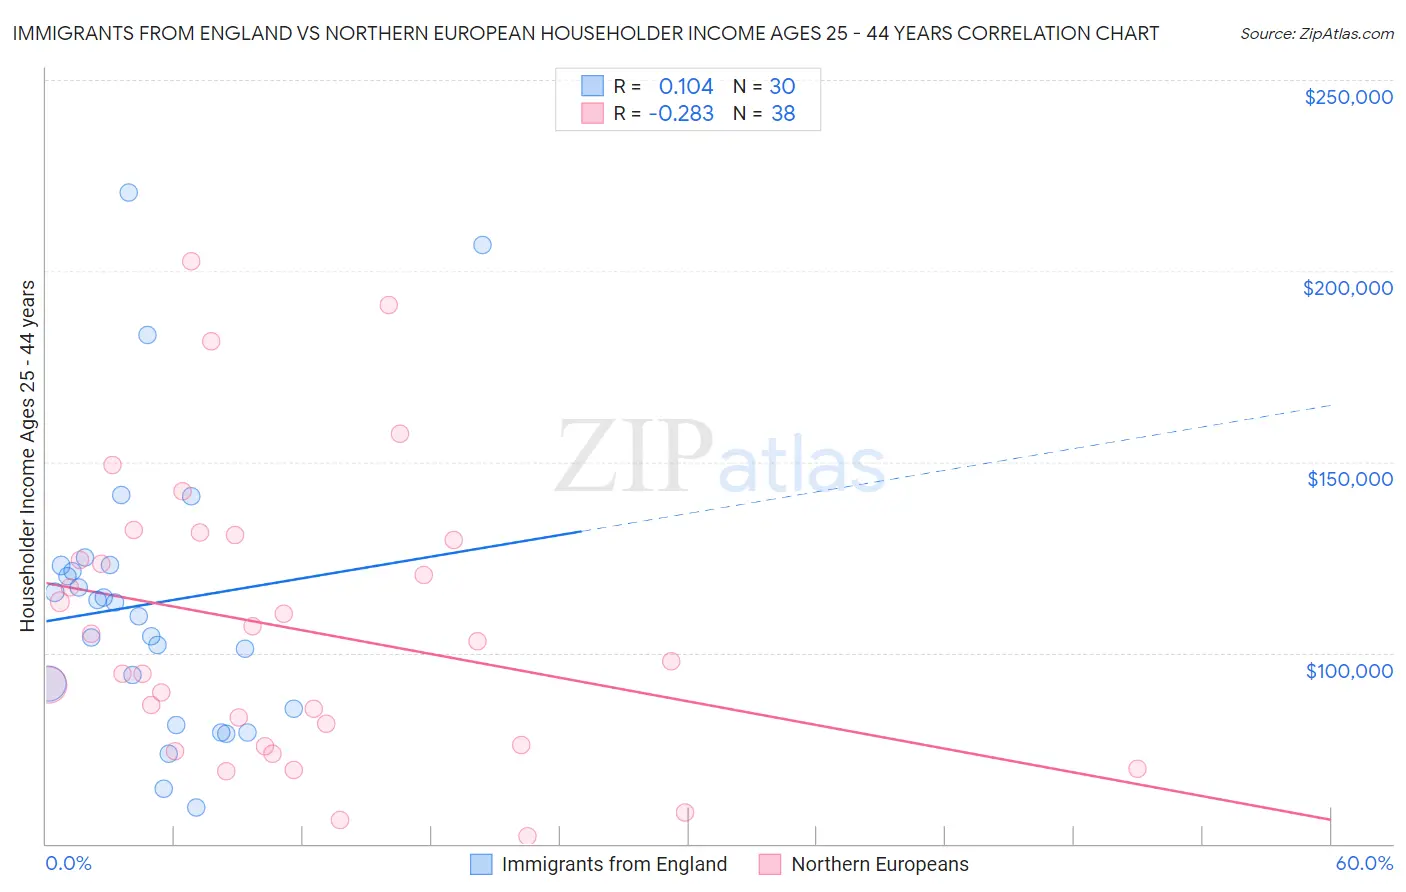
Immigrants from England vs Northern European Householder Income Ages 25 - 44 years Correlation Chart
The statistical analysis conducted on geographies consisting of 390,728,278 people shows a poor positive correlation between the proportion of Immigrants from England and household income with householder between the ages 25 and 44 in the United States with a correlation coefficient (R) of 0.104 and weighted average of $102,020. Similarly, the statistical analysis conducted on geographies consisting of 404,748,237 people shows a weak negative correlation between the proportion of Northern Europeans and household income with householder between the ages 25 and 44 in the United States with a correlation coefficient (R) of -0.283 and weighted average of $100,457, a difference of 1.6%.
Householder Income Ages 25 - 44 years Correlation Summary
| Measurement | Immigrants from England | Northern European |
| Minimum | $59,375 | $51,817 |
| Maximum | $220,451 | $202,571 |
| Range | $161,076 | $150,754 |
| Mean | $112,915 | $106,570 |
| Median | $111,398 | $100,458 |
| Interquartile 25% (IQ1) | $85,313 | $75,848 |
| Interquartile 75% (IQ3) | $122,883 | $129,485 |
| Interquartile Range (IQR) | $37,570 | $53,637 |
| Standard Deviation (Sample) | $37,421 | $36,774 |
| Standard Deviation (Population) | $36,792 | $36,287 |
Demographics Similar to Immigrants from England and Northern Europeans by Householder Income Ages 25 - 44 years
In terms of householder income ages 25 - 44 years, the demographic groups most similar to Immigrants from England are Sri Lankan ($101,960, a difference of 0.060%), Assyrian/Chaldean/Syriac ($101,936, a difference of 0.080%), Macedonian ($101,882, a difference of 0.14%), Austrian ($101,842, a difference of 0.17%), and Immigrants from Kazakhstan ($101,727, a difference of 0.29%). Similarly, the demographic groups most similar to Northern Europeans are Immigrants from Vietnam ($100,535, a difference of 0.080%), Immigrants from Brazil ($100,534, a difference of 0.080%), Immigrants from South Eastern Asia ($100,283, a difference of 0.17%), Immigrants from North Macedonia ($100,101, a difference of 0.36%), and Immigrants from Afghanistan ($99,977, a difference of 0.48%).
| Demographics | Rating | Rank | Householder Income Ages 25 - 44 years |
| Ukrainians | 98.8 /100 | #90 | Exceptional $102,451 |
| Croatians | 98.7 /100 | #91 | Exceptional $102,414 |
| Immigrants | North America | 98.7 /100 | #92 | Exceptional $102,407 |
| Immigrants | England | 98.4 /100 | #93 | Exceptional $102,020 |
| Sri Lankans | 98.4 /100 | #94 | Exceptional $101,960 |
| Assyrians/Chaldeans/Syriacs | 98.3 /100 | #95 | Exceptional $101,936 |
| Macedonians | 98.3 /100 | #96 | Exceptional $101,882 |
| Austrians | 98.3 /100 | #97 | Exceptional $101,842 |
| Immigrants | Kazakhstan | 98.1 /100 | #98 | Exceptional $101,727 |
| Taiwanese | 97.9 /100 | #99 | Exceptional $101,492 |
| Immigrants | Argentina | 97.8 /100 | #100 | Exceptional $101,415 |
| Albanians | 97.8 /100 | #101 | Exceptional $101,367 |
| Immigrants | Lebanon | 97.4 /100 | #102 | Exceptional $101,124 |
| Immigrants | Moldova | 97.4 /100 | #103 | Exceptional $101,091 |
| Immigrants | Poland | 97.4 /100 | #104 | Exceptional $101,065 |
| Immigrants | Vietnam | 96.5 /100 | #105 | Exceptional $100,535 |
| Immigrants | Brazil | 96.5 /100 | #106 | Exceptional $100,534 |
| Northern Europeans | 96.3 /100 | #107 | Exceptional $100,457 |
| Immigrants | South Eastern Asia | 96.0 /100 | #108 | Exceptional $100,283 |
| Immigrants | North Macedonia | 95.6 /100 | #109 | Exceptional $100,101 |
| Immigrants | Afghanistan | 95.3 /100 | #110 | Exceptional $99,977 |