Immigrants from England vs Immigrants from Moldova Median Family Income
COMPARE
Immigrants from England
Immigrants from Moldova
Median Family Income
Median Family Income Comparison
Immigrants from England
Immigrants from Moldova
$112,038
MEDIAN FAMILY INCOME
99.2/ 100
METRIC RATING
82nd/ 347
METRIC RANK
$109,975
MEDIAN FAMILY INCOME
97.7/ 100
METRIC RATING
96th/ 347
METRIC RANK
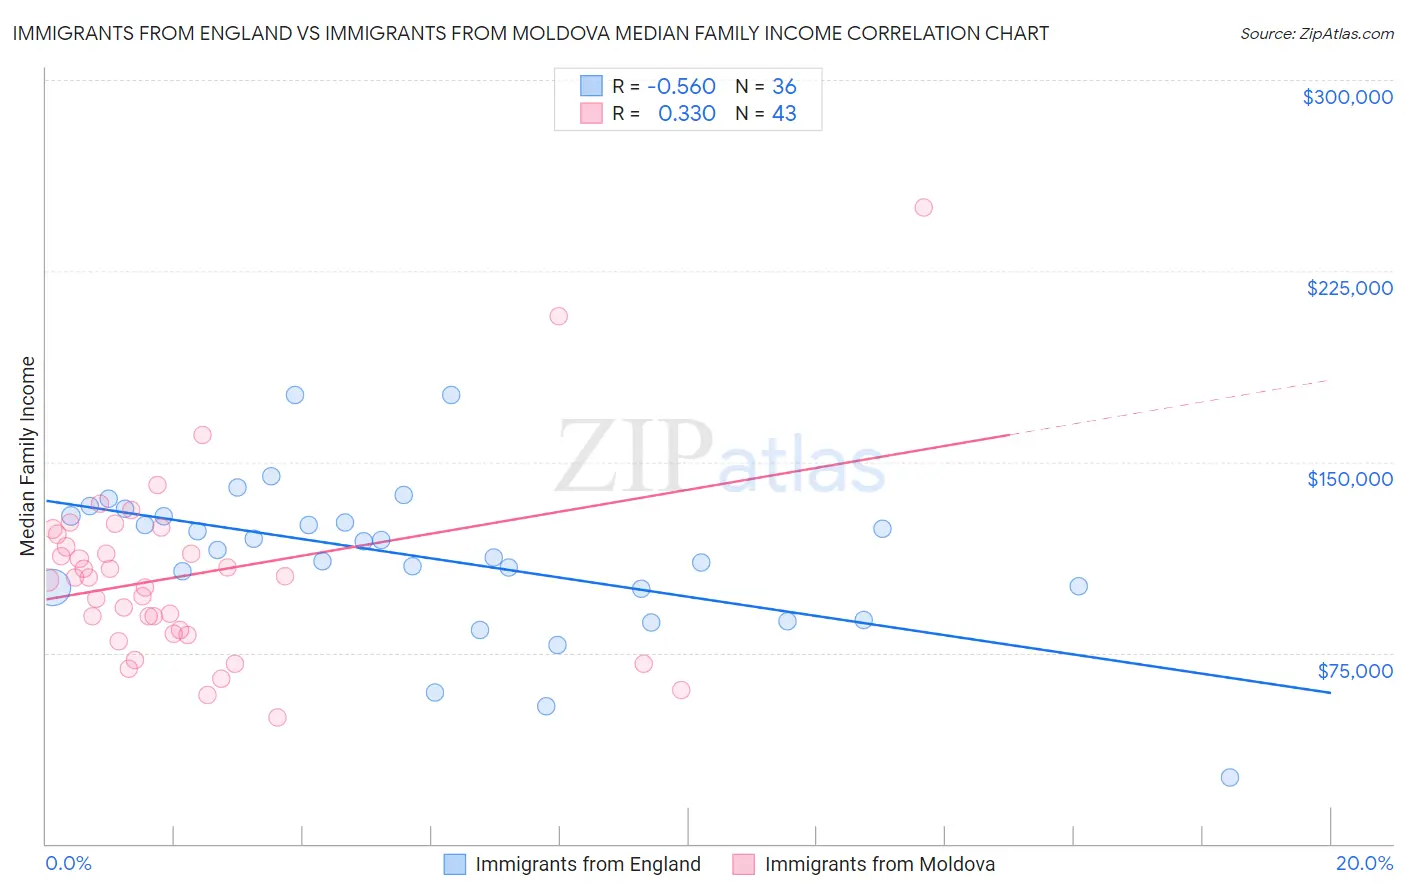
Immigrants from England vs Immigrants from Moldova Median Family Income Correlation Chart
The statistical analysis conducted on geographies consisting of 391,652,266 people shows a substantial negative correlation between the proportion of Immigrants from England and median family income in the United States with a correlation coefficient (R) of -0.560 and weighted average of $112,038. Similarly, the statistical analysis conducted on geographies consisting of 124,358,975 people shows a mild positive correlation between the proportion of Immigrants from Moldova and median family income in the United States with a correlation coefficient (R) of 0.330 and weighted average of $109,975, a difference of 1.9%.
Median Family Income Correlation Summary
| Measurement | Immigrants from England | Immigrants from Moldova |
| Minimum | $26,250 | $49,474 |
| Maximum | $176,139 | $250,001 |
| Range | $149,889 | $200,527 |
| Mean | $112,548 | $105,716 |
| Median | $117,120 | $104,398 |
| Interquartile 25% (IQ1) | $100,437 | $82,625 |
| Interquartile 75% (IQ3) | $128,664 | $121,587 |
| Interquartile Range (IQR) | $28,227 | $38,962 |
| Standard Deviation (Sample) | $29,901 | $36,710 |
| Standard Deviation (Population) | $29,483 | $36,280 |
Demographics Similar to Immigrants from England and Immigrants from Moldova by Median Family Income
In terms of median family income, the demographic groups most similar to Immigrants from England are Immigrants from North America ($112,151, a difference of 0.10%), Immigrants from Croatia ($112,323, a difference of 0.25%), Italian ($112,372, a difference of 0.30%), Immigrants from Egypt ($111,689, a difference of 0.31%), and Immigrants from Hungary ($111,378, a difference of 0.59%). Similarly, the demographic groups most similar to Immigrants from Moldova are Zimbabwean ($110,011, a difference of 0.030%), Jordanian ($109,865, a difference of 0.10%), Korean ($110,103, a difference of 0.12%), Immigrants from Kazakhstan ($110,137, a difference of 0.15%), and Immigrants from Lebanon ($110,159, a difference of 0.17%).
| Demographics | Rating | Rank | Median Family Income |
| Italians | 99.3 /100 | #79 | Exceptional $112,372 |
| Immigrants | Croatia | 99.3 /100 | #80 | Exceptional $112,323 |
| Immigrants | North America | 99.2 /100 | #81 | Exceptional $112,151 |
| Immigrants | England | 99.2 /100 | #82 | Exceptional $112,038 |
| Immigrants | Egypt | 99.0 /100 | #83 | Exceptional $111,689 |
| Immigrants | Hungary | 98.8 /100 | #84 | Exceptional $111,378 |
| Croatians | 98.8 /100 | #85 | Exceptional $111,370 |
| Ukrainians | 98.8 /100 | #86 | Exceptional $111,368 |
| Austrians | 98.8 /100 | #87 | Exceptional $111,306 |
| Romanians | 98.8 /100 | #88 | Exceptional $111,243 |
| Immigrants | Argentina | 98.5 /100 | #89 | Exceptional $110,873 |
| Northern Europeans | 98.3 /100 | #90 | Exceptional $110,635 |
| Immigrants | Southern Europe | 98.3 /100 | #91 | Exceptional $110,614 |
| Immigrants | Lebanon | 97.9 /100 | #92 | Exceptional $110,159 |
| Immigrants | Kazakhstan | 97.8 /100 | #93 | Exceptional $110,137 |
| Koreans | 97.8 /100 | #94 | Exceptional $110,103 |
| Zimbabweans | 97.7 /100 | #95 | Exceptional $110,011 |
| Immigrants | Moldova | 97.7 /100 | #96 | Exceptional $109,975 |
| Jordanians | 97.5 /100 | #97 | Exceptional $109,865 |
| Immigrants | Kuwait | 97.4 /100 | #98 | Exceptional $109,731 |
| Armenians | 97.3 /100 | #99 | Exceptional $109,692 |