Immigrants from Egypt vs Finnish Median Family Income
COMPARE
Immigrants from Egypt
Finnish
Median Family Income
Median Family Income Comparison
Immigrants from Egypt
Finns
$111,689
MEDIAN FAMILY INCOME
99.0/ 100
METRIC RATING
83rd/ 347
METRIC RANK
$102,676
MEDIAN FAMILY INCOME
50.0/ 100
METRIC RATING
174th/ 347
METRIC RANK
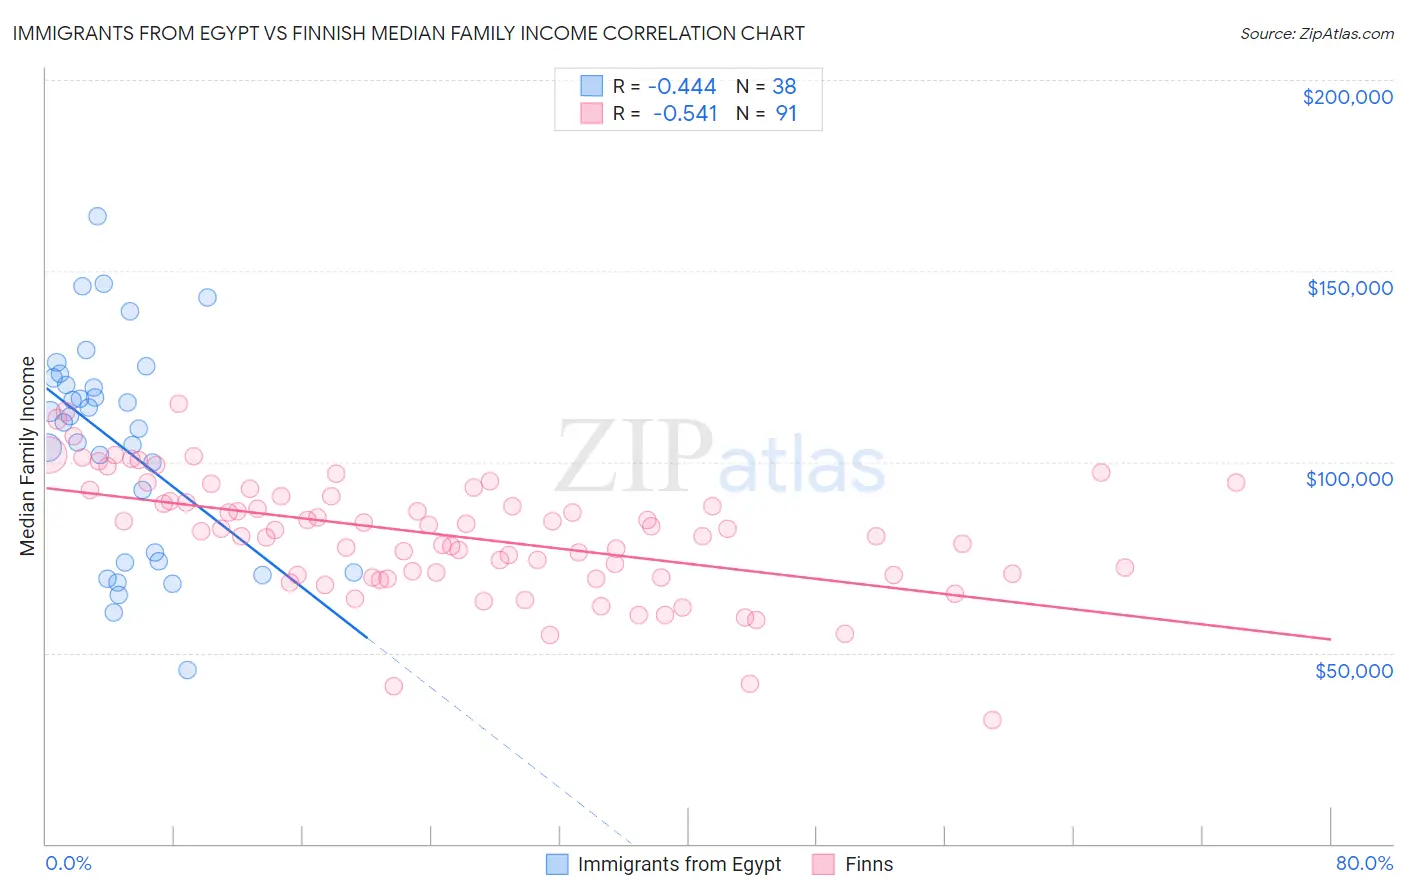
Immigrants from Egypt vs Finnish Median Family Income Correlation Chart
The statistical analysis conducted on geographies consisting of 245,384,191 people shows a moderate negative correlation between the proportion of Immigrants from Egypt and median family income in the United States with a correlation coefficient (R) of -0.444 and weighted average of $111,689. Similarly, the statistical analysis conducted on geographies consisting of 404,403,352 people shows a substantial negative correlation between the proportion of Finns and median family income in the United States with a correlation coefficient (R) of -0.541 and weighted average of $102,676, a difference of 8.8%.
Median Family Income Correlation Summary
| Measurement | Immigrants from Egypt | Finnish |
| Minimum | $45,581 | $32,321 |
| Maximum | $164,298 | $115,182 |
| Range | $118,717 | $82,861 |
| Mean | $104,674 | $80,730 |
| Median | $111,132 | $82,170 |
| Interquartile 25% (IQ1) | $74,063 | $70,230 |
| Interquartile 75% (IQ3) | $122,004 | $91,138 |
| Interquartile Range (IQR) | $47,941 | $20,909 |
| Standard Deviation (Sample) | $28,077 | $15,710 |
| Standard Deviation (Population) | $27,705 | $15,623 |
Similar Demographics by Median Family Income
Demographics Similar to Immigrants from Egypt by Median Family Income
In terms of median family income, the demographic groups most similar to Immigrants from Egypt are Immigrants from Hungary ($111,378, a difference of 0.28%), Croatian ($111,370, a difference of 0.29%), Ukrainian ($111,368, a difference of 0.29%), Immigrants from England ($112,038, a difference of 0.31%), and Austrian ($111,306, a difference of 0.34%).
| Demographics | Rating | Rank | Median Family Income |
| Argentineans | 99.4 /100 | #76 | Exceptional $112,665 |
| Immigrants | Eastern Europe | 99.4 /100 | #77 | Exceptional $112,527 |
| Immigrants | Canada | 99.3 /100 | #78 | Exceptional $112,374 |
| Italians | 99.3 /100 | #79 | Exceptional $112,372 |
| Immigrants | Croatia | 99.3 /100 | #80 | Exceptional $112,323 |
| Immigrants | North America | 99.2 /100 | #81 | Exceptional $112,151 |
| Immigrants | England | 99.2 /100 | #82 | Exceptional $112,038 |
| Immigrants | Egypt | 99.0 /100 | #83 | Exceptional $111,689 |
| Immigrants | Hungary | 98.8 /100 | #84 | Exceptional $111,378 |
| Croatians | 98.8 /100 | #85 | Exceptional $111,370 |
| Ukrainians | 98.8 /100 | #86 | Exceptional $111,368 |
| Austrians | 98.8 /100 | #87 | Exceptional $111,306 |
| Romanians | 98.8 /100 | #88 | Exceptional $111,243 |
| Immigrants | Argentina | 98.5 /100 | #89 | Exceptional $110,873 |
| Northern Europeans | 98.3 /100 | #90 | Exceptional $110,635 |
Demographics Similar to Finns by Median Family Income
In terms of median family income, the demographic groups most similar to Finns are Belgian ($102,788, a difference of 0.11%), Immigrants from Eritrea ($102,823, a difference of 0.14%), Immigrants from Eastern Africa ($102,451, a difference of 0.22%), French ($102,368, a difference of 0.30%), and Alsatian ($103,010, a difference of 0.33%).
| Demographics | Rating | Rank | Median Family Income |
| South American Indians | 61.9 /100 | #167 | Good $103,624 |
| Immigrants | Peru | 60.8 /100 | #168 | Good $103,534 |
| Czechoslovakians | 57.6 /100 | #169 | Average $103,273 |
| Immigrants | Uzbekistan | 56.6 /100 | #170 | Average $103,197 |
| Alsatians | 54.3 /100 | #171 | Average $103,010 |
| Immigrants | Eritrea | 51.9 /100 | #172 | Average $102,823 |
| Belgians | 51.4 /100 | #173 | Average $102,788 |
| Finns | 50.0 /100 | #174 | Average $102,676 |
| Immigrants | Eastern Africa | 47.1 /100 | #175 | Average $102,451 |
| French | 46.1 /100 | #176 | Average $102,368 |
| Germans | 44.6 /100 | #177 | Average $102,254 |
| Welsh | 43.3 /100 | #178 | Average $102,151 |
| South Americans | 39.7 /100 | #179 | Fair $101,856 |
| French Canadians | 37.0 /100 | #180 | Fair $101,634 |
| Spaniards | 36.8 /100 | #181 | Fair $101,617 |